Category:Gross domestic product
Idi na navigaciju
Idi na pretragu
| gross domestic product on sister projects: | ||||||||||
|---|---|---|---|---|---|---|---|---|---|---|
Wiktionary |
Wikinews |
Wikiquote |
Wikibooks |
Wikisource |
Wikiversity | |||||
English: Gross domestic product (GDP).
.
market value of goods and services produced within a country  | |||||
| Postavi datoteku | |||||
| Je podklasa od | |||||
|---|---|---|---|---|---|
| Različito od | |||||
| |||||
Potkategorije
Prikazano je 9 potkategorija, od ukupno 9.
Stranice u kategoriji "Gross domestic product"
Ova kategorija sadrži samo sljedeću stranicu.
Datoteke u kategoriji "Gross domestic product"
Prikazano je 200 datoteka u ovoj kategoriji, od ukupno 209.
(prethodna stranica) (sljedeća stranica)-
 2020 EU ratio of GNI to GDP.png 1.240 × 1.514; 165 KB
-
 2020 RCEP-15's share of global GDP.svg 1.166 × 630; 7 KB
-
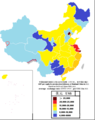 2021年中國各省人均gdp.png 990 × 1.246; 334 KB
-
 6 nation gpi ru.jpg 741 × 738; 60 KB
-
 Annual Gross World Product Growth 1,000,000-2011 DeLong.png 1.576 × 560; 19 KB
-
 Arab League countries by GDP (nominal).png 940 × 625; 162 KB
-
 Bbp drie grootste economieen 1980 2017.svg 567 × 319; 12 KB
-
 Bbp economieen 3 tm 10 1980 2017.svg 567 × 319; 16 KB
-
 Bbp enkele economieen 1980 2017.svg 567 × 319; 16 KB
-
 Bbp enkele europese economieen 1980 2017.svg 567 × 319; 16 KB
-
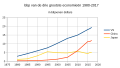
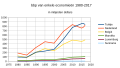
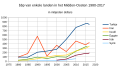 Bbp midden oosten 1980 2017.svg 567 × 319; 16 KB
-
 Bbp twaalf landen 1980 2017.svg 567 × 319; 17 KB
-
 Bbp vier kleine economieen 1980 2017.svg 567 × 319; 13 KB
-
 Bbp wereldeconomie en de twee grootste economieen 1980 2017.svg 567 × 319; 15 KB
-
 BIPBRD5004.svg 800 × 550; 49 KB
-
 BKT vaesto Eurooppa.PNG 1.228 × 700; 79 KB
-
 Bruttoinlandsprodukt DE.svg 723 × 578; 17 KB
-
 Bruttoinlandsprodukt Deutschland - Verwendung 2013.svg 832 × 496; 31 KB
-
 Bruttoinlandsprodukt.pdf 1.752 × 1.239; 264 KB
-
 BruttostaatsschuldenEuro.png 958 × 593; 29 KB
-
 BruttostaatsschuldenEuroEngl.png 958 × 593; 30 KB
-
 CarbonEmissionsAndGDP.png 976 × 637; 32 KB
-
 Ceremonial counties in England by gross value added 2021.png 4.765 × 6.618; 2,09 MB
-
 Ceremonial counties in England by GVA 2021.png 4.765 × 6.618; 2 MB
-
 Chile and Latin America GDP Average.png 852 × 490; 38 KB
-
 China's real GDP growth by decade.svg 495 × 360; 7 KB
-
 CIA WFB TotFertilityRate-GDP-Population - Complete 2016.png 8.328 × 5.863; 544 KB
-
 CIA WFB TotFertilityRate-GDP-Population - Simplified 2016.png 8.354 × 5.835; 521 KB
-
 CO2 emissions vs GDP.svg 850 × 600; 60 KB
-
 Commonwealth countries by GDP (nominal).png 2.139 × 1.458; 290 KB
-
 Commonwealth countries by GDP (PPP).png 2.105 × 1.391; 278 KB
-
 Consumer spending- Economic growth.png 1.403 × 821; 203 KB
-
 Countries by GDP (Nominal) in 2014.png 1.024 × 470; 187 KB
-
 Countries with economy larger than Eurozone.png 7.000 × 3.627; 2,23 MB
-
 CreixementPIB.jpeg 629 × 356; 90 KB
-
 Croissance du PIB de la France et du G7 de 1980 a 2022.png 1.232 × 853; 94 KB
-
 CubaTotalGDP.png 1.606 × 1.103; 99 KB
-
 Cyprus GDP.svg 512 × 427; 37 KB
-
 Debt profile of Eurozone countries-ar.png 727 × 734; 36 KB
-
 Debt profile of Eurozone countries.png 727 × 734; 57 KB
-
Dessine-moi l'éco - Qu'est-ce que le Produit Intérieur Brut (PIB).webm 2 min 53 s, 1.280 × 720; 13,44 MB
-
 EAGLEs Nest or Watch List.JPG 500 × 436; 118 KB
-
 EAGLEs和G7.jpg 825 × 764; 60 KB
-
 Energy consumption versus GDP.png 1.120 × 766; 56 KB
-
 Eurostat Graph tec00018.png 1.496 × 1.080; 51 KB
-
 Eurostat Graph tec00021.png 1.496 × 1.080; 52 KB
-
 Eurostat Graph tec00026.png 1.496 × 1.080; 54 KB
-
 Eurostat Graph tec00115.png 1.556 × 1.080; 50 KB
-
 Eurostat Graph tsdde410.png 1.346 × 1.080; 51 KB
-
 Eurostat Graph.png 1.116 × 581; 42 KB
-
 Eurozone-structural1.jpg 859 × 553; 60 KB
-
 Evolution of GDP per capita in some former Soviet countries.svg 842 × 595; 21 KB
-
 Evolution PIB 1000 2000.GIF 833 × 459; 13 KB
-
 ExImUSAJBRD.PNG 960 × 594; 57 KB
-
 Federal state local percent of gdp.webp 5.595 × 1.772; 117 KB
-
 Fertility rate.jpg 673 × 535; 110 KB
-
 Forecast-short-2013.pdf 522 × 441; 41 KB
-
 GDP & PPP Calc by ksg.pdf 1.275 × 1.650, 6 stranica; 501 KB
-
 GDP and Population of European Countries 2010.png 1.236 × 698; 45 KB
-
 GDP Armenia Georgia Azerbaijan 1990 2016.jpg 683 × 409; 76 KB
-
 GDP Categories - United States.png 960 × 720; 204 KB
-
 Gdp chart.png 750 × 436; 14 KB
-
 GDP Chart.svg 512 × 298; 18 KB
-
 GDP China USA.png 474 × 268; 8 KB
-
 GDP EU TOP 5.svg 990 × 765; 16 KB
-
 GDP Eurozone.png 970 × 604; 21 KB
-
 GDP growth 1923-2009.jpg 640 × 400; 35 KB
-
 GDP Growth Rate Comparison Mongolia-World 2000-2012.png 826 × 679; 51 KB
-
 GDP Growth Rate India (World Bank data).png 2.502 × 1.454; 141 KB
-

-
 GDP history United States.png 5.174 × 2.181; 459 KB
-
 GDP Nominal 2022.png 6.460 × 3.403; 1,5 MB
-
 GDP of Indian states 2020.png 3.818 × 4.600; 1,01 MB
-
 GDP of Kenya.png 727 × 677; 57 KB
-
 GDP of nuclear-weapon states (billions of 2019 USD).svg 630 × 630; 74 KB
-
 GDP of Porto Alegre.png 1.364 × 600; 53 KB
-
 GDP PPP 2009 2014.jpg 586 × 327; 24 KB
-
 GDP PPP Poland.svg 1.130 × 550; 23 KB
-
 GDP PPP Russia.svg 1.130 × 590; 6 KB
-
 GDP PPP Ukraine.svg 1.000 × 450; 4 KB
-
 GDP PPP USA China.svg 1.200 × 500; 10 KB
-
 GDP PPP USA.svg 1.000 × 510; 12 KB
-
 GDP to Tax revenue.png 4.705 × 2.622; 377 KB
-
 GDP variation Brazil.png 894 × 369; 52 KB
-
 GDP vs Crude.PNG 391 × 345; 5 KB
-
 GDP vs GPI in US.jpg 225 × 260; 18 KB
-
 GDP-2016.png 838 × 497; 63 KB
-
 GDP-Caribbean.png 800 × 473; 97 KB
-
 GDPDeflator01.png 677 × 420; 11 KB
-
 Global Energy Intensity of GDP trend PPPandMER.jpg 813 × 692; 153 KB
-
 GNP Botswana vs subAfrica.png 649 × 428; 11 KB
-
 Government Debt- Economic growth.png 1.242 × 829; 107 KB
-
 Green GDP.1993.JPG 864 × 706; 165 KB
-
 Gross domestic product Botswana Our World In Data.png 3.400 × 2.400; 364 KB
-
 Gross Domestic Product- Economic Growth.png 1.003 × 345; 120 KB
-
 Gross National Product- Economic growth.png 1.519 × 788; 55 KB
-
 Growth GBP 2.PNG 1.066 × 417; 44 KB
-
 Growth GPD.jpg 2.835 × 1.115; 1,56 MB
-
 GRSchuKrise.png 960 × 595; 32 KB
-
 GRSchuKriseEngl-ar.png 960 × 595; 32 KB
-
 GRSchuKriseEngl.png 960 × 595; 26 KB
-
 Guckst du.PNG 874 × 435; 28 KB
-
 Historical GDP growth of Argentina.png 1.151 × 605; 82 KB
-
 Historical GDP growth of Japan.png 1.151 × 605; 40 KB
-
 Historical GDP growth of South Korea.png 1.151 × 605; 57 KB
-
 Historical GDP growth of the Philippines.png 1.151 × 605; 38 KB
-
 Historical GDP growth of the United States.png 1.151 × 605; 36 KB
-
 Historical top 10 nominal GDP proportion 2018.svg 512 × 658; 15 KB
-
 Historical top 10 nominal GDP proportion.svg 512 × 512; 30 KB
-

-
 HZ GDP and POPULATION.JPG 678 × 577; 47 KB
-
 IMF 2013 GDP forecasts.svg 315 × 279; 42 KB
-
 IMF Real GDP growth by country (Oct 2022).png 2.640 × 1.585; 575 KB
-
-
 InterestRGrowthDiff.PNG 959 × 593; 37 KB
-
 IrlSchuKrise.png 960 × 594; 37 KB
-
 IrlSchuKriseEngl-ar.png 960 × 594; 58 KB
-
 IrlSchuKriseEngl.png 960 × 594; 36 KB
-
 Istorical GDP growth of Thailand.png 1.151 × 605; 42 KB
-
-
 KZinsDiff.PNG 970 × 604; 36 KB
-
 Mexican states by GDP (2022).png 2.700 × 1.710; 379 KB
-
 Moldova GDP Nominal vs Other Countries.jpg 1.204 × 735; 358 KB
-
 Moldova GDP PPP vs Other Countries.jpg 1.204 × 735; 329 KB
-
 Moldova Money Transfers.jpg 1.204 × 735; 303 KB
-
 Moscow-Russia GDP 1997-2002 english.png 640 × 427; 3 KB
-
 Moscow-Russia GDP 1997-2002 hungarian.png 640 × 427; 3 KB
-
 Mt sectors gdp cs.png 398 × 344; 2 KB
-
 Namibia GDP per capita.png 1.134 × 699; 41 KB
-
 National IQ v GDP.webp 1.455 × 671; 58 KB
-
 National-Russia-curve.png 978 × 607; 148 KB
-
 New York (state) counties by GDP (2021).png 5.770 × 4.326; 2,17 MB
-
 Newspapers as a percent of US GDP.svg 630 × 630; 17 KB
-
 Nominal GDP of Countries Crimea edited.svg 512 × 260; 817 KB
-
 Nominal GDP of Countries Crimea.svg 512 × 260; 793 KB
-
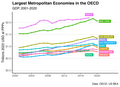 OECD Top 10 Metro GDP.png 2.750 × 2.000; 283 KB
-
 OECD Top 10 Metro GDP.svg 512 × 316; 84 KB
-
 Pakistan gdp.png 573 × 416; 18 KB
-
 Peoples bulgaria gdppc.png 3.400 × 2.400; 217 KB
-
 PIB 2011.png 1.024 × 604; 69 KB
-
 PIB a precios constantes.png 1.926 × 1.077; 108 KB
-
 PIB de la zona euro.png 1.028 × 600; 128 KB
-
 Pib de venezuela.png 533 × 307; 23 KB
-
 PIB mundial en los dos últimos milenios.svg 1.449 × 790; 29 KB
-
 Pib nigeria.PNG 492 × 290; 6 KB
-
 Pib-nominal-RD.jpeg 645 × 600; 107 KB
-
 PIBmunMT2019.png 5.176 × 5.024; 1,6 MB
-

-
 PIL YoY Q2 2011 paesi europei - GDP YoY Q2 2011 European countries.png 4.544 × 3.174; 159 KB
-
 Podil-hdp.png 912 × 632; 550 KB
-
 Private sector workers earnings compared to GDP.webp 4.418 × 2.340; 140 KB
-
 PTSchuKrise.png 960 × 594; 37 KB
-
 PTSchuKriseEngl-ar.png 960 × 594; 50 KB
-
 PTSchuKriseEngl.png 960 × 594; 30 KB
-
 Quarterly GDP US.png 1.484 × 605; 134 KB
-
 Quarterly gross domestic product and federal funds rate.png 4.776 × 1.962; 387 KB
-
 Quarterly gross domestic product.png 4.837 × 1.928; 234 KB
-
 RCEP Member GDP and Population.png 1.178 × 443; 27 KB
-
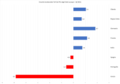
 Real GDP Growth Rate of Major Economies 2023.png 1.920 × 1.080; 335 KB
-
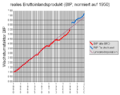 Reales-Bruttoinlandsprodukt-Deutschland-1950-2000.png 707 × 558; 9 KB
-

-
 Russia GDP distribution Federal Districts.png 2.290 × 1.058; 132 KB
-
 Russian economic history 1885-2018.svg 405 × 315; 65 KB
-
 Sektorers bidrag till Sveriges BNP 1800-2000.svg 993 × 559; 301 KB
-
 ShortIntRGrowthDiff.PNG 970 × 604; 37 KB
-
 South Korea GDP (PPP).png 1.046 × 799; 143 KB
-
 South Korea's GDP (nominal) growth from 1960 to 2007.png 481 × 289; 24 KB
-
 STZAKVVP.png 419 × 279; 16 KB
-
 Swedish counties by GDP (2015).png 3.150 × 2.032; 404 KB
-
 Tax Revenue as Share of GDP for OECD Countries in 2009.jpg 652 × 1.061; 76 KB
-
 TFR vs PPP 2009.svg 900 × 750; 17 KB
-
 Thai GDP graph.png 772 × 440; 24 KB
-

-
 TheGreatModeration.png 1.280 × 780; 83 KB
-
 TheTenStrongestEconomiesInTheWorldBetween2006-2016.png 976 × 710; 36 KB
-
 Top 10 2050.jpg 586 × 306; 23 KB
-
 Top Capital Gains Tax Rates and Economic Growth 1950-2011.jpg 663 × 448; 69 KB
-
 Top five largest economies in 2050.jpg 1.355 × 602; 71 KB
-
 Top tax rates and average growth 1975-2008 v3.jpg 974 × 791; 96 KB
-
 Turkey-co2-emissions-and-gdp.svg 850 × 600; 34 KB
-
 UK vs US post-crisis GDP.png 480 × 291; 50 KB
-
 Unit root hypothesis diagram.svg 525 × 329; 2 KB
-
 United States GDP.webp 5.308 × 2.080; 91 KB
-
 United States wealth compared to the rest of the world.gif 613 × 331; 16 KB
-
 US GDP by year.png 4.228 × 2.495; 259 KB
-
 Variazione-annuale-del-PIL 1990-2021.png 1.239 × 796; 58 KB
-
 Venezuela - PIB pc PPA.png 825 × 569; 28 KB
-
 Venezuela ECON INDIC ZF (1998-2012).png 1.110 × 1.610; 173 KB
-
 Video game industry revenue vs nominal GDP.png 1.920 × 980; 88 KB
-
 WeltBIPWorldgroupOECD.PNG 1.754 × 1.239; 249 KB
-
 WeltBIPWorldgroupOECDengl.PNG 1.568 × 980; 204 KB
-
 Wertschöpfungskette am Beispiel Orangensaftherstellung.svg 800 × 350; 24 KB
-
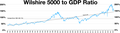 Wilshire 5000 to GDP ratio.webp 4.753 × 1.324; 154 KB
-
 Word GDP Growth.png 979 × 601; 12 KB
-
 World Economy languages.png 1.200 × 800; 202 KB
-
 World GDP list in 2050-2.PNG 572 × 801; 77 KB
-
 World GDP list in 2050.PNG 938 × 650; 39 KB
-
 World map of emission intensity 2018.svg 850 × 667; 131 KB
-
 WorldWarII-GDP-Relations-Allies-Axis hu.svg 640 × 630; 26 KB
-
 WorldWarII-GDP-Relations-Allies-Axis-simple.png 640 × 415; 6 KB


.png)


.png)
.png)

_in_2014.png)


.png)


.png)


.png)


_counties_by_GDP_(2021).png)


_-_Italy_quarter_GDP_at_Costant_prices_(Q3_2006_-_Q4_2019).png)


.png)
_growth_from_1960_to_2007.png)

.png)


.png)


.svg)