Category:Economic diagrams
Jump to navigation
Jump to search
English: Diagrams in the field of economics.
Economic diagrams are distinct from economic charts and graphs because diagrams are based on economic models, not real data. Economic diagrams demonstrate an abstract concept rather than a real life scenario, unlike an economic graph or chart.
Economic diagrams are distinct from economic charts and graphs because diagrams are based on economic models, not real data. Economic diagrams demonstrate an abstract concept rather than a real life scenario, unlike an economic graph or chart.
Subcategories
This category has the following 35 subcategories, out of 35 total.
- Economic diagrams in Dutch (36 F)
*
A
B
C
- Clark's Sector model (9 F)
- Customer Journey Maps (5 F)
D
- Diminishing returns (7 F)
E
- Edgeworth box diagrams (26 F)
- Engel's law (5 F)
I
- Economic illustrations (13 F)
- Isoquants (9 F)
M
N
P
- Payoff diagrams (118 F)
R
- Risk attitude (8 F)
T
U
- Utility functions (19 F)
V
- Economic Venn diagrams (37 F)
Pages in category "Economic diagrams"
This category contains only the following page.
Media in category "Economic diagrams"
The following 200 files are in this category, out of 982 total.
(previous page) (next page)-
 04 production-possibilities-frontier-1.png 360 × 367; 14 KB
-
 04 production-possibilities-frontier-2.png 360 × 367; 17 KB
-
 1942 Illustratie De organisatie van de Nederlandsche industrie.jpg 2,881 × 2,631; 1.83 MB
-
 5 stage plannnig.jpg 520 × 362; 73 KB
-
 6a00d83451623c69e201b8d25d6a97970c-800wi.png 493 × 592; 30 KB
-
 7 sh2.gif 600 × 422; 6 KB
-
 = COMPOUND RANGES.png 839 × 408; 52 KB
-
 = SIMPLE ranges.png 888 × 492; 59 KB
-
 CAP Analysis.png 894 × 397; 133 KB
-
 AD-IA図.gif 402 × 402; 8 KB
-
 Advance and Protect Cycle.png 1,266 × 496; 299 KB
-
 Adó hatása.png 480 × 330; 12 KB
-
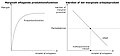
 Aghion-Howitt model, equilibrium.jpg 522 × 435; 27 KB
-
 Aghion-Howitt model, growth.jpg 530 × 440; 23 KB
-
 Agrarpolitik.jpg 609 × 329; 21 KB
-
 Aide conventionnelle.svg 464 × 391; 7 KB
-
 Aktierisiko.JPG 1,001 × 639; 27 KB
-
 All About Money.svg 1,000 × 1,210; 97 KB
-
 Allocative-efficiency-numbers.png 757 × 551; 77 KB
-
 Alokacni efektivnost 3.png 546 × 419; 23 KB
-
 Amenidad1.JPG 548 × 482; 15 KB
-
 Amenidad2.JPG 770 × 485; 27 KB
-
 Andorra en Xifres.png 613 × 816; 187 KB
-
 Anormaler Verlauf ohne Sozialsystem.jpg 1,161 × 787; 30 KB
-
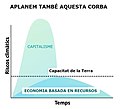 Aplanem la corba.jpg 771 × 698; 69 KB
-
 Arbeiterstrich Mindestlohn Arbeitslosigkeit im Neoklassischen Modell.pdf 625 × 1,233; 37 KB
-
 Arbeiterstrich Mindestlohn Arbeitslosigkeit im Neoklassischen Modell.svg 376 × 741; 1.84 MB
-
 Arbejdsløshed graf1.jpg 400 × 300; 64 KB
-
 Arbejdsløshed graf2.jpg 400 × 400; 53 KB
-
 Arbejdsløshed tegning1.jpg 502 × 163; 8 KB
-
 Arbejdsmarked.jpg 1,394 × 652; 55 KB
-
 AS Keynsian curve pakistan.png 960 × 720; 18 KB
-
 Atkinson.pdf 1,239 × 1,754; 13 KB
-
 Auswirkung von Zöllen.jpg 6,000 × 2,891; 1.15 MB
-
 Autocorrelation 1.JPG 446 × 382; 8 KB
-
 Avantage comparatif.svg 1,454 × 1,883; 207 KB
-
 Average fixed cost.png 923 × 519; 22 KB
-
 AWE Model.png 720 × 540; 31 KB
-
 Azadi gold coin Price.jpg 2,098 × 765; 71 KB
-
 Balloon graph representing quality EROI.png 850 × 625; 217 KB
-
 Bar vs Candlestick.png 1,152 × 731; 7 KB
-
 BarChart.jpg 303 × 135; 15 KB
-
 Bargeldlose-Zahlungen-Transaktionen.png 600 × 450; 32 KB
-
 Bargeldlose-Zahlungen-Volumen.png 600 × 450; 34 KB
-
 Basic diamond coconut model diagram.JPG 538 × 504; 19 KB
-
 Bayes-rule3.png 995 × 584; 76 KB
-
 Bear-flag-example.jpg 500 × 330; 84 KB
-
 Beispiel ISMA.jpg 518 × 345; 29 KB
-
 Beispiel-sw-kompass.png 670 × 618; 8 KB
-
 Beitragssatz SV D 2011.PNG 987 × 628; 54 KB
-
 Beveridge Curve (Theta against u).svg 400 × 348; 16 KB
-
 Beveridge Curve (u against v).svg 364 × 251; 10 KB
-
 Bid rent1.png 1,504 × 1,129; 48 KB
-

-
 Bild 2 - uhd - Typischer Verlauf eines Wertverhaeltnisses.png 3,840 × 2,160; 419 KB
-
 Bjh.png 221 × 215; 3 KB
-
 Blank J-curve.jpg 327 × 323; 9 KB
-
 Bond price.jpg 597 × 311; 12 KB
-
 Boserup PL.svg 1,052 × 744; 6 KB
-
 Boukaseff scale.png 328 × 238; 10 KB
-
 Bowen's Model Graph.JPG 612 × 408; 23 KB
-
 Bowen's model.jpg 852 × 623; 42 KB
-
 Bowens Model.JPG 656 × 432; 20 KB
-
 Brender spencer.JPG 471 × 416; 18 KB
-
 Burbuja inmobiliaria.svg 451 × 312; 10 KB
-
 Business cycle.jpg 1,280 × 960; 99 KB
-
 Business Unites Cooperate in Producing Services, 1921.jpg 811 × 625; 84 KB
-
 Business Unites in producing the Service of Money, 1921.jpg 805 × 451; 68 KB
-
 Buy Call Option.jpg 762 × 560; 35 KB
-
 Buy Put Option.jpg 752 × 560; 34 KB
-
 BWS pro Kopf.svg 800 × 350; 46 KB
-
 Bérnövekedés hatása.png 480 × 330; 13 KB
-
 Cadena de Valor de Michael Porter.png 763 × 488; 65 KB
-
 Calculus Graph-Finding Maximum Profit.png 346 × 266; 6 KB
-
 Capital labour.jpg 387 × 613; 70 KB
-
 Carbon Pricing Matrix.png 800 × 800; 59 KB
-
 Carré magique format image.png 2,092 × 1,392; 721 KB
-
 Cartographie d'allumage.jpg 746 × 683; 69 KB
-
 Cartographie injection.png 510 × 346; 8 KB
-
 Cash Flow at Risk.jpg 882 × 562; 76 KB
-
 CC-PP Game.png 1,096 × 732; 78 KB
-
 Cds paymentstream loss event.svg 540 × 380; 21 KB
-
 Cds paymentstream noloss.svg 540 × 380; 26 KB
-
 Cds paymentstream protection loss event el.svg 540 × 380; 21 KB
-
 Cds paymentstream protection loss event.svg 540 × 380; 21 KB
-
 Cds paymentstream protection noloss el.svg 540 × 380; 26 KB
-
 Cds paymentstream protection noloss.svg 540 × 380; 26 KB
-
 Cds zahlungsfluss ausfall.svg 625 × 375; 21 KB
-
 CEE 2005 impulse response functions.png 972 × 683; 71 KB
-
 Cena optymalna punkt.png 469 × 265; 5 KB
-
 Cena optymalna wykres.png 368 × 289; 7 KB
-
 Central-bank-number.jpg 1,177 × 765; 151 KB
-
 CES anelastic.jpg 338 × 273; 19 KB
-
 CES elastic.jpg 345 × 279; 17 KB
-
 Characteristics-of-organic-products.png 2,292 × 1,454; 67 KB
-
 CincoPilaresRevolución J.Rifkin 2.png 2,225 × 1,950; 257 KB
-
 CincoPilaresRevolución J.Rifkin.png 2,225 × 1,950; 232 KB
-
 Circuit flow of money by W.T. Foster, 1922.jpg 780 × 1,286; 211 KB
-
 Circular economy scheme (It).svg 694 × 438; 140 KB
-
 Cjcbi.svg 232 × 232; 3 KB
-
 Clip image005.png 535 × 348; 6 KB
-
 Clipboard01-1.jpg 215 × 150; 9 KB
-
 Coase-Theorem Szenario 2.png 600 × 600; 21 KB
-
 Coaseho teorem.jpg 363 × 273; 8 KB
-
 CobWebDe.jpg 691 × 521; 79 KB
-
 Cocreation.jpg 400 × 254; 48 KB
-
 Comitari Market-Positioning Security Solutions Map.png 935 × 772; 94 KB
-
 Commitment in stakeholder management.png 440 × 272; 10 KB
-
 Comparative Advantage.jpg 960 × 720; 77 KB
-

-
 CompetitiveAdvantage2.png 486 × 508; 36 KB
-
 CompetitiveMarket-Wiki.jpg 1,055 × 430; 68 KB
-
 Complstruct06.jpg 428 × 212; 29 KB
-
 Complstruct06a.jpg 428 × 201; 26 KB
-
 Complstruct07.jpg 425 × 161; 27 KB
-
 Complstruct08.jpg 314 × 154; 23 KB
-
 Complstruct09.jpg 686 × 505; 96 KB
-
 Complstruct14.jpg 437 × 288; 41 KB
-
 Conceptual Timeline.png 1,584 × 1,223; 19 KB
-
ConMal.ogg 2 min 36 s; 1.51 MB
-
 Constant EIS utility curves.svg 600 × 400; 30 KB
-
 Consumer constraint choice income shift.png 357 × 250; 7 KB
-
 Consumer constraint choice price shift lo.png 357 × 246; 8 KB
-
 Consumer constraint choice price shift.png 357 × 246; 7 KB
-
 Consumer constraint choice.png 357 × 246; 5 KB
-

-
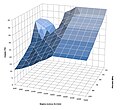
 Contour-plot.jpg 988 × 852; 133 KB
-
 Cooperating Specialized Business Units (after Nystrom), 1921.jpg 797 × 467; 68 KB
-
 Cooperating specialized business units in Egg Production, 1921.jpg 788 × 586; 62 KB
-

-
 Coordination failure chart.svg 550 × 450; 11 KB
-
 COSO-02.svg 512 × 512; 35 KB
-
 Coso.png 286 × 264; 25 KB
-
 Cost per Product using HW SW protection.png 2,653 × 1,794; 144 KB
-
 Courbe des taux inversée.jpg 1,684 × 1,189; 138 KB
-
 Courbe environnement.png 693 × 329; 22 KB
-
 Cournot egyensúly.PNG 480 × 330; 9 KB
-
 Cournot játék.PNG 440 × 270; 10 KB
-
 Cournot stakelberg.PNG 513 × 538; 13 KB
-
 Cournot.png 529 × 402; 13 KB
-
 Cournotduopoly.svg 800 × 800; 11 KB
-
 Cournotolig.svg 400 × 400; 7 KB
-
 Coutfixe.svg 512 × 724; 4 KB
-
 CPPI Portfolio Percent in Risky Asset.jpg 715 × 487; 84 KB
-
 Crowding Out.jpg 984 × 801; 93 KB
-
 CurvaLM.jpg 500 × 500; 30 KB
-
 Curve del consumo e del risparmio.PNG 295 × 236; 3 KB
-
 CVP-TC-FC-VC-Sales-Contrib-VC-PL.svg 1,200 × 1,000; 4 KB
-
 CWF smart grid bubbles.jpg 514 × 502; 23 KB
-
 Cycles classiques des prix.png 737 × 482; 15 KB
-
 Cykl życia kryzysu gospodarczego.png 819 × 567; 43 KB
-
 Dalton-Index.png 1,301 × 1,301; 53 KB
-
 DatabasesMarketShares-2015-05.png 585 × 353; 29 KB
-
 Davanzati exchange diagram.jpg 481 × 459; 66 KB
-
 Deflation.gif 349 × 282; 3 KB
-
 Development-waterfall-4.png 594 × 234; 12 KB
-
 Dezentral1.jpg 1,485 × 1,208; 55 KB
-
 Dezentral3.jpg 1,485 × 1,208; 43 KB
-
 Diag01LD.png 1,587 × 608; 88 KB
-
 Diag02ED.png 777 × 608; 44 KB
-
 Diagram - 2.png 600 × 300; 16 KB
-
 Diagram of economic history and theory, 1889.jpg 1,277 × 1,539; 849 KB
-
 Diagram of gratifying wants, 1921.jpg 1,110 × 376; 76 KB
-
 Diagram of Social Dynamics, 1889.jpg 1,442 × 1,378; 367 KB
-
 Diagram of Wages-Fund Theory, 1885.png 544 × 575; 59 KB
-
 Diamond coconut flow diagram.JPG 814 × 504; 33 KB
-
 Diamond-Water paradox.png 1,200 × 900; 34 KB
-
 Dibujo4.JPG 315 × 174; 6 KB
-
 Different-Types-of-Trade1.png 749 × 435; 13 KB
-
 Differentiation of productive enterprises, 1921.jpg 807 × 463; 59 KB
-
 Diminishing return.jpg 400 × 281; 7 KB
-
 Diminishing Returns Graph.svg 884 × 634; 2 KB
-
 Diminishing Returns Graphs.png 703 × 1,094; 240 KB
-
 Diminishing Returns Graphs.svg 703 × 1,094; 5 KB
-
 Discount1.jpg 270 × 189; 23 KB
-
 Discount2.jpg 351 × 210; 22 KB
-
 Distance function.png 374 × 316; 16 KB
-

-

-
 Dividende Monetaire Zone Euro.jpg 867 × 515; 39 KB
-
 Dividende Universel.JPG 689 × 470; 22 KB
-
 Dobra substytucyjne.png 1,732 × 1,273; 78 KB
-
 Donut.png 450 × 334; 52 KB
-
 Dornbusch1.jpg 960 × 720; 55 KB
-
 Drei-Linien-Modell des IIA.jpg 1,695 × 1,170; 445 KB
-
 Drop-Shipping.png 1,000 × 909; 116 KB
-
 DS flow chart- running spread flow GERMAN.svg 515 × 103; 2 KB
-
 Du Pont-modellen.jpg 1,081 × 646; 174 KB
-
 Duasubkitaranhayatekonomi.PNG 884 × 512; 37 KB
-
 Durbin watson statistic.jpg 613 × 380; 26 KB
-
 Durvexity.GIF 342 × 354; 3 KB
-
 Eagles against the other economic concepts e.JPG 2,166 × 813; 821 KB
-
 Eagles against the other economic concepts i.JPG 1,083 × 407; 262 KB
-
 EAGLEs和其他新兴市场概念.jpg 2,166 × 813; 234 KB
-
 EBQ Cost - Batch size Chart.jpg 235 × 215; 7 KB
-
 Ec emp.jpg 846 × 491; 78 KB
-
 Ec emp1.jpg 2,920 × 1,858; 906 KB
-
 Economic Cycle.jpg 3,000 × 2,250; 289 KB
-
 Economic diagram in Persian.png 403 × 313; 10 KB
-
 Economic Life triange, 1909.jpg 535 × 458; 34 KB


.svg)
.svg)


.svg)


_and_Takeaway_(hour-based).png)


,_1921.jpg)


