Category:Normal distribution
Перейти до навігації
Перейти до пошуку
безперервнозмінний розподіл ймовірностей  | |||||
| Завантажити медіафайл | |||||
| Аудіозапис зачитаного тексту | |||||
|---|---|---|---|---|---|
| Є підкласом |
| ||||
| Підтема для | |||||
| Названо на честь | |||||
| |||||
Normal distribution, also called Gaussian distribution.
Підкатегорії
Показано 9 підкатегорій із 9.
Файли в категорії «Normal distribution»
Показано 200 файлів цієї категорії (із 308).
(попередня сторінка) (наступна сторінка)-
De-Gauß-Verteilung.ogg 2,0с; 20 КБ
-
De-Gaußkurve.ogg 1,8с; 18 КБ
-
De-Normalverteilung.ogg 2,3с; 22 КБ
-
 001 Dwustronny obszar krytyczny.svg 1411 × 887; 10 КБ
-
 002 Lewostronny obszar krytyczny.svg 1411 × 887; 5 КБ
-
 003 Prawostronny obszar krytyczny.svg 1411 × 887; 5 КБ
-
 08fig-empirical.png 700 × 432; 35 КБ
-
 08fig-standardize.png 1170 × 373; 60 КБ
-
 2AFC task, normal distribution model.png 355 × 403; 22 КБ
-
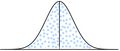
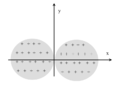
 2D Normally Distributed Points.png 600 × 400; 27 КБ
-
 A-normal-distribution-with-areas-under-curve-1.png 3900 × 2400; 194 КБ
-

-
 Angenäherte Gaußglocke(5*5).JPG 465 × 462; 23 КБ
-
 Anpassungstests.svg 703 × 468; 65 КБ
-
 Anscombe transform animated.gif 800 × 400; 849 КБ
-
 Antropoloogia õppetahvel. Eesti meeste kehapikkuse modifikatsioon.jpg 4282 × 3123; 1,76 МБ
-
 Assss.png 443 × 173; 3 КБ
-
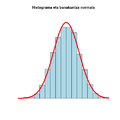 Banakuntza normala histograma 01.png 480 × 480; 15 КБ
-
 Bell curve of intake versus health effect.svg 1394 × 906; 11 КБ
-
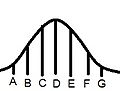
 Bell Curve Showing 100 Faces to Illustrate Percentile Rank.png 765 × 325; 30 КБ
-
 Bell telephone magazine (1922) (14569352030).jpg 2018 × 1440; 330 КБ
-
 Bellcurve.svg 512 × 320; 662 байтів
-
 Bernoulli normalfördelning graf.png 319 × 142; 4 КБ
-
 Bernoulli12.png 256 × 192; 2 КБ
-
 Bernoulli60.png 256 × 192; 975 байтів
-
 Bertillon - Identification anthropométrique (1893) 041.png 852 × 524; 583 КБ
-
 Bi normal.pdf 900 × 900; 5 КБ
-
 BinDistApprox large.png 504 × 481; 18 КБ
-
 Binomial Distribution.svg 1008 × 962; 39 КБ
-
 Boston Winter Snowfall Counts Distribution.png 1113 × 783; 96 КБ
-
 Bound.png 754 × 615; 26 КБ
-

-
 Boxplot vs PDF-be.svg 598 × 652; 492 КБ
-
 Boxplot vs PDF.png 703 × 731; 9 КБ
-
 Boxplot vs PDF.svg 598 × 652; 493 КБ
-
 ClassementELOFIDE2008.jpg 1168 × 703; 90 КБ
-
 CLTBinomConvergence.svg 1012 × 650; 33 КБ
-

-
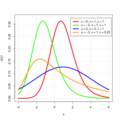
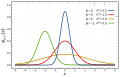
 Comparing normal distributions 001.png 745 × 500; 50 КБ
-
 Confidence Interval 90P.png 400 × 263; 10 КБ
-
 Confidence interval and standard score.png 2450 × 2450; 468 КБ
-
 Confidence intervals for different confidence levels.gif 1200 × 687; 40 КБ
-
 ConfIntervNormalP.png 494 × 297; 6 КБ
-
 Contrainte resistance 2d eloigne.svg 523 × 445; 126 КБ
-
 Contrainte resistance 2d proche.svg 511 × 445; 127 КБ
-
 Cp 0.00.png 807 × 435; 11 КБ
-
 Cp 1.00.png 807 × 435; 11 КБ
-
 Cp 1.33.png 807 × 435; 12 КБ
-
 Cp 1.66.png 807 × 435; 12 КБ
-
 Critique of the Theory of Evolution Fig 074.jpg 648 × 336; 11 КБ
-
 Cumulative vs normal histogram cz.svg 900 × 450; 67 КБ
-
 Cumulative vs normal histogram.svg 900 × 450; 52 КБ
-
 Curva a campana.png 1240 × 705; 76 КБ
-
 Curva Anormal.jpg 482 × 232; 42 КБ
-
 Curva Gaussiana.png 537 × 303; 17 КБ
-
 Curva normal 2.jpg 711 × 375; 30 КБ
-
 Curva normal.JPG 293 × 180; 9 КБ
-
 Darstellung des Conditional Value at Risk.png 2333 × 1147; 115 КБ
-
 De moivre-laplace.gif 250 × 155; 21 КБ
-
 Densnormdis.PNG 515 × 374; 51 КБ
-
 Desommation gaussienne lorentzienne.svg 610 × 460; 59 КБ
-
 Desommation trois pics gaussiens.svg 610 × 460; 128 КБ
-
 Diagramma standaardafwijking.png 476 × 202; 8 КБ
-
 Discrete Gaussian kernel.svg 450 × 538; 35 КБ
-
 Discrete Gaussians.svg 428 × 495; 66 КБ
-
 DisNormal.svg 1700 × 700; 15 КБ
-
 DisNormal02.svg 1700 × 700; 14 КБ
-
 DisNormal03.svg 1700 × 700; 15 КБ
-
 DisNormal04.svg 1700 × 700; 15 КБ
-
 DisNormal05.svg 1700 × 700; 16 КБ
-
 DisNormal06.svg 1700 × 700; 16 КБ
-
 DisNormal07.svg 1700 × 700; 14 КБ
-
 DisNormal08.svg 1700 × 700; 15 КБ
-
 DisNormal09.svg 1700 × 700; 15 КБ
-
 DisNormal10.svg 1700 × 700; 15 КБ
-
 Distribuciongaussiana.JPG 474 × 272; 9 КБ
-
 Distribusi Sigma.gif 905 × 370; 46 КБ
-
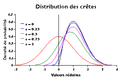 Distribution des crêtes.png 314 × 206; 4 КБ
-
 Double Gauss.png 384 × 192; 3 КБ
-
 EB1911 Probability - probability-curve.jpg 758 × 609; 36 КБ
-
 EMG Distribution CDF.png 480 × 480; 45 КБ
-
 EMG Distribution PDF.png 480 × 480; 53 КБ
-
-
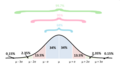 Empirical Rule Normal Distribution.png 1107 × 599; 31 КБ
-
 Es15p140.png 770 × 544; 8 КБ
-
 Exp squared function.svg 1300 × 975; 8 КБ
-
 ExTableNorm.PNG 311 × 306; 11 КБ
-
 E^(-x^2).svg 600 × 480; 37 КБ
-
 Fehler Normal.svg 480 × 280; 18 КБ
-
 Fehler Streuung.svg 480 × 290; 17 КБ
-
 Fig3.png 560 × 420; 5 КБ
-
 Fisher iris versicolor sepalwidth.svg 822 × 567; 17 КБ
-
 Folded normal pdf.svg 640 × 360; 42 КБ
-
 Folded-cumulative-distribution-function.svg 619 × 507; 106 КБ
-
 Fonction caracteristique normale.svg 425 × 284; 21 КБ
-
 Gausian B.png 606 × 297; 12 КБ
-
 Gausienne.png 182 × 178; 2 КБ
-
 Gauss and Lorentz lineshapes.png 500 × 357; 15 КБ
-
 Gauss and Lorentz lineshapes.svg 1082 × 695; 63 КБ
-
 Gauss and Lorentz lineshapes2.png 448 × 290; 3 КБ
-
 Gauss distribution.png 600 × 421; 24 КБ
-
 Gauss reduite.svg 667 × 451; 24 КБ
-
 Gauss-en kanpaia Banaketa normala.svg 704 × 246; 34 КБ
-
 Gauss-filter-impulsantwort.PNG 949 × 707; 26 КБ
-
 Gauss-Filter-Impulsantwort.svg 526 × 394; 32 КБ
-
 Gauss-filter-uebertragungsfunktion.PNG 994 × 701; 36 КБ
-
 Gauss-Filter-Uebertragungsfunktion.svg 526 × 394; 75 КБ
-
 Gauss-primes-768x768.png 768 × 768; 27 КБ
-
 Gauss-sum.svg 1084 × 688; 66 КБ
-
 Gauss1.jpg 370 × 260; 7 КБ
-
 Gaussian and Lorentzian profiles.png 1080 × 720; 52 КБ
-
 Gaussian by stevencys.jpg 561 × 420; 16 КБ
-
 Gaussian curve ENG.jpg 960 × 720; 33 КБ
-
 Gaussian curve.svg 709 × 222; 4 КБ
-
 Gaussian differences.svg 543 × 683; 208 КБ
-
 Gaussian distribution 2.jpg 360 × 250; 7 КБ
-
 Gaussian distribution darts demonstration.svg 655 × 503; 13 КБ
-
 Gaussian distribution log-lin plot.png 481 × 311; 14 КБ
-
 Gaussian distribution log-log plot.png 501 × 311; 13 КБ
-
 Gaussian distribution thick lines.svg 772 × 549; 3 КБ
-
 Gaussian distribution.svg 210 × 100; 5 КБ
-
 Gaussian Filter.svg 700 × 502; 19 КБ
-
 Gaussian function graph (52,12) vs (52,24).gif 471 × 171; 3 КБ
-
 Gaussian function graph (52,24).gif 416 × 171; 2 КБ
-
 Gaussian function graph (52,6) vs (52,12).gif 360 × 236; 3 КБ
-
 Gaussian function graph.png 720 × 460; 49 КБ
-
 Gaussian Histogram 10million samples 100K bins.png 1914 × 943; 13 КБ
-
 Gaussian mechanism.png 528 × 411; 22 КБ
-
 Gaussian wave packet.svg 512 × 386; 2 КБ
-
 Gaussian, Lorentzian and Voigt profiles.png 1080 × 720; 65 КБ
-
 Gaussian-mixture-example.png 300 × 250; 13 КБ
-
 Gaussiana a due code.png 402 × 259; 4 КБ
-
 Gaussiana a una coda.png 402 × 259; 4 КБ
-
 Gaussoarithmetique.svg 1201 × 1394; 73 КБ
-
 Gaussova distribuce.png 579 × 408; 19 КБ
-
 Gaussova křivka.jpg 803 × 296; 29 КБ
-
 Generalized normal densities.svg 720 × 540; 110 КБ
-
 Grafico distribuzione Frequenze - Prezzi.JPG 797 × 612; 74 КБ
-
 Gráfico da função gaussiana.svg 800 × 480; 32 КБ
-

-
 Histogramm.png 431 × 378; 12 КБ
-
 Histogramme loi normale 50 ech numpy pyplot.png 375 × 252; 3 КБ
-
 Histogramme loi normale.svg 563 × 438; 17 КБ
-
 Hores solars pic.png 711 × 380; 5 КБ
-
 Interdisz.png 110 × 110; 3 КБ
-
 IQ - distribuição simétrica.gif 650 × 468; 409 КБ
-
 IQ curve (2).svg 600 × 480; 9 КБ
-
 IQ curve.png 781 × 491; 7 КБ
-
 IQ curve.svg 600 × 480; 9 КБ
-
 IQ Distributions and Occupations.jpg 1028 × 765; 131 КБ
-
 Iqr with quantile.png 742 × 428; 27 КБ
-
 Iqr.png 1024 × 584; 12 КБ
-
 Jamama Planar Plots.jpg 560 × 420; 16 КБ
-
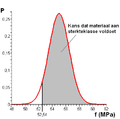 Karakteristieke sterkte.PNG 406 × 403; 9 КБ
-
 Konfidenz.png 798 × 443; 22 КБ
-
 Laplace mechanism.png 528 × 417; 22 КБ
-
Mathematrix Normalverteilung BRP.webm 14хв 43с, 609×411; 34,85 МБ
-
 Maximum de vraisemblance dispersion loi normale centree reduite.svg 1594 × 773; 204 КБ
-
 Maximum de vraisemblance position loi normale centree reduite.svg 1126 × 838; 167 КБ
-
 Mean estimator consistency.gif 800 × 325; 4,53 МБ
-
 Mplwp expnegxsqr.svg 600 × 400; 20 КБ
-
 Mplwp gaussian logscale.svg 600 × 400; 43 КБ
-
 Mplwp gaussian wavepacket f4.svg 600 × 400; 38 КБ
-
 Mplwp gaussian.svg 600 × 400; 23 КБ
-
 Mplwp Voigt-0,03,07,1.svg 600 × 400; 37 КБ
-
 Mplwp Voigt-0,05,1.svg 600 × 400; 37 КБ
-
 Mplwp Voigt-HWHM1.svg 600 × 400; 41 КБ
-
 Mplwp Voigt-samemax.svg 600 × 400; 38 КБ
-
 Nieznormalizowane radialne funkcje bazowe.png 694 × 467; 9 КБ
-
 Normal approximation to binomial.png 1300 × 975; 92 КБ
-
 Normal approximation to binomial.svg 600 × 480; 18 КБ
-
 Normal density-2.svg 931 × 715; 43 КБ
-
 Normal density.svg 800 × 600; 7 КБ
-
 Normal dist density cumulative 0001.jpg 3600 × 4700; 604 КБ
-
 Normal distribution and scales tr.gif 1200 × 687; 41 КБ
-
 Normal distribution and scales.gif 1200 × 687; 39 КБ
-
 Normal Distribution CDF Diagram (z≤0).svg 200 × 100; 16 КБ
-
 Normal Distribution CDF Diagram.svg 200 × 100; 18 КБ
-
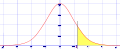
 Normal distribution curve with all below upper tail shaded.jpg 206 × 127; 4 КБ
-
 Normal distribution curve with lower tail shaded.jpg 206 × 127; 5 КБ
-
 Normal distribution curve with lower to upper tail shaded.jpg 206 × 127; 4 КБ
-

-
-

-

-
 Normal distribution curve with middle shaded.jpg 206 × 127; 4 КБ
-
 Normal distribution curve with tails shaded.jpg 206 × 127; 4 КБ
-
 Normal distribution curve with upper tail shaded.jpg 206 × 127; 5 КБ
-
 Normal distribution curve.jpg 206 × 127; 5 КБ
-
 Normal Distribution Far-Right CDF Diagram.svg 200 × 100; 16 КБ
-
 Normal distribution function.png 1597 × 869; 70 КБ
-
 Normal Distribution NIST.gif 422 × 300; 3 КБ
-
 Normal distribution of gunshot impact NT.PNG 800 × 640; 49 КБ
-
 Normal distribution pdf.png 1300 × 975; 25 КБ
-
 Normal Distribution PDF.png 707 × 444; 47 КБ
-
 Normal distribution pdf.svg 600 × 480; 11 КБ
-
 Normal Distribution PDF.svg 720 × 460; 63 КБ
-
 Normal Distribution Sigma.svg 1292 × 623; 3 КБ
-
 Normal marginals.png 1000 × 500; 66 КБ
-
 Normal-data.jpg 223 × 115; 3 КБ


.JPG)


_(14569352030).jpg)


_041.png)


.svg)


_vs_(52,12).gif)


.svg)


.svg)


_vs_(52,24).gif)
.gif)