Category:Psychometrics
Zur Navigation springen
Zur Suche springen
Gebiet der Psychologie _b_264.jpg) | |||||
| Medium hochladen | |||||
| Ist ein(e) | |||||
|---|---|---|---|---|---|
| Unterklasse von | |||||
| Verschieden von | |||||
| Teilweise übereinstimmend mit |
| ||||
| |||||
Unterkategorien
Es werden 9 von insgesamt 9 Unterkategorien in dieser Kategorie angezeigt:
In Klammern die Anzahl der enthaltenen Kategorien (K), Seiten (S), Dateien (D)
Seiten in der Kategorie „Psychometrics“
Diese Kategorie enthält nur die folgende Seite.
Medien in der Kategorie „Psychometrics“
Folgende 96 Dateien sind in dieser Kategorie, von 96 insgesamt.
-
 1995-SAT-vs-Income-Education.png 1.500 × 1.862; 39 KB
-
 3 profils.png 819 × 412; 74 KB
-
 Attachment Theory Two Dimension Model.png 550 × 400; 7 KB
-
 Barnes maze.jpg 476 × 426; 133 KB
-
 Best-Worst Scaling.png 2.943 × 845; 40 KB
-
 Bio q2.jpg 672 × 504; 35 KB
-
 Blacktest score rise.jpg 400 × 310; 22 KB
-
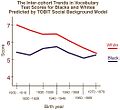 Blackwhite trendbirthyear.jpg 525 × 483; 34 KB
-
 Bodźce–stwierdzenia.gif 150 × 100; 6 KB
-
 Boussole des couleurs.png 455 × 314; 31 KB
-
 Caractéristique Profil Bleu.png 466 × 69; 4 KB
-
 Caractéristique Profil Jaune.png 466 × 79; 4 KB
-
 Caractéristique Profil Rouge.png 462 × 65; 4 KB
-
 Caractéristique Profil Vert.png 466 × 68; 3 KB
-
 Caractéristiques des couleurs.png 598 × 435; 86 KB
-
 Carroll three stratum model of human Intelligence.png 757 × 346; 72 KB
-
 Carroll three stratum.svg 904 × 443; 122 KB
-
 Cda sur iris.jpg 762 × 532; 49 KB
-
 Chabris2007a.svg 696 × 532; 43 KB
-

-
 Congeneric measurement model.png 1.000 × 800; 45 KB
-
 Content mapping for GBI parcels onto the 7 Up-7 Down scales.png 1.592 × 1.424; 114 KB
-
 Content mapping for GBI parcels--10 item Mania and Depression forms.png 1.672 × 1.414; 163 KB
-
 CPCs.png 640 × 289; 97 KB
-
 DichotomeRaschExample01 Wikibooks.png 583 × 582; 24 KB
-
 DichotomeRaschExample02 Wikibooks.png 577 × 585; 35 KB
-
 DichotomeRaschExample03 Wikibooks.png 575 × 585; 60 KB
-
 Dwenda cook medley hostility scale graph 1.jpg 902 × 527; 44 KB
-
 Dwenda cook medley hostility scale graph 2.jpg 1.502 × 658; 126 KB
-
 Eq tests.PNG 657 × 353; 10 KB
-
 Evalmatic-machine-professor-peter-saville.jpg 1.200 × 657; 421 KB
-
 FactorAnalysis SimpleModel.png 1.033 × 392; 25 KB
-
 Grafik potrebnostey.jpg 731 × 760; 87 KB
-
 Guilfords cube.png 833 × 720; 35 KB
-
 ICC slope ip.png 834 × 708; 22 KB
-
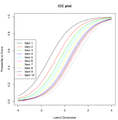
 ICCs prog.png 512 × 235; 5 KB
-
 Illogical.png 308 × 249; 8 KB
-
 Implicational Lattice.jpg 359 × 137; 35 KB
-
 Intelligence for children in Jiangxi province, 1930.png 2.917 × 3.981; 160 KB
-
 INTER-NDA Standards Chart.png 1.106 × 1.559; 238 KB
-
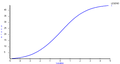
 IQ curve (2).svg 600 × 480; 9 KB
-
 IQ curve.svg 600 × 480; 9 KB
-
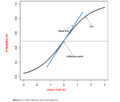
 ItemCharacteristicCurve.png 881 × 693; 12 KB
-
 Kh beh depr 00-09 gbe-bund.png 1.736 × 1.639; 336 KB
-
 Likert scale.png 1.148 × 268; 23 KB
-
 LinkCorrelation1.png 254 × 77; 1 KB
-
 LinkCorrelation2.png 214 × 191; 2 KB
-
 LinkCorrelation3.png 290 × 157; 3 KB
-
 Matrice delle componenti.JPG 282 × 120; 10 KB
-
 Matrice di correlazione.jpg 625 × 125; 19 KB
-
 Matt's PhD Study.jpg 3.072 × 2.304; 2,35 MB
-
 MHDIFTable.png 1.415 × 568; 32 KB
-
 Moral-foundations-value-correlation.svg 540 × 360; 38 KB
-
 MTMM model v2.PNG 922 × 692; 101 KB
-
 MTMM model.PNG 922 × 692; 101 KB
-
 Multi-Trait, Multi-Method (MTMM) example.gif 1.008 × 720; 55 KB
-
 Nonuni DIF ICC.png 715 × 675; 17 KB
-
 NonuniformDIF.png 765 × 646; 19 KB
-
 Numerische Rating-Skala.png 794 × 140; 11 KB
-
 Ocena 360 stopni.png 640 × 640; 141 KB
-
 PEBLTowerOfLondon.png 626 × 531; 14 KB
-
 PerceptualMap1.png 343 × 256; 11 KB
-
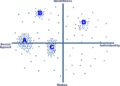 PerceptualMap2.png 373 × 268; 6 KB
-
 PersItm.PNG 785 × 397; 20 KB
-
 Pic5.ahm.JPG 488 × 520; 44 KB
-
 Pic6.ahm.JPG 628 × 398; 27 KB
-
 Professor-Peter-Saville-Brochures-graphic-design.jpg 1.457 × 1.080; 1,06 MB
-
 Psychometrist tests trainees in a compression chamber.jpg 734 × 486; 323 KB
-
 Psychometry.jpg 586 × 878; 104 KB
-
 Psychopy.png 256 × 256; 50 KB
-
 RaschICC.gif 588 × 271; 3 KB
-
 Reakcje–wypowiedzi.gif 150 × 100; 6 KB
-
 Reliabilitas.JPG 683 × 300; 16 KB
-
 Reliability of the 7 Down depression form based on Item Response Theory.png 1.783 × 976; 69 KB
-
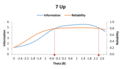 Reliability of the 7 Up mania form based on Item Response Theory.png 1.822 × 1.043; 66 KB
-
 Reliability of the GBI Depression 10 item form A, based on Item Response Theory.png 1.861 × 1.018; 74 KB
-
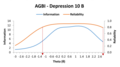 Reliability of the GBI Depression 10 item form B, based on Item Response Theory.png 1.853 × 1.034; 74 KB
-

-
 Rook crowding smoothed.JPG 614 × 433; 34 KB
-

-
 SpearmanFactors.png 200 × 200; 3 KB
-
 SpearmanFactors.svg 400 × 400; 1.015 Bytes
-
 Standard ten scale-example.png 1.269 × 662; 9 KB
-
 Strategia psychometryczna – wartościowanie deklaracyjne.gif 150 × 100; 6 KB
-
 Tabl potrebnostey.jpg 792 × 761; 159 KB
-
 Tautological Lattice.jpg 358 × 116; 42 KB
-
 TCC.PNG 657 × 353; 7 KB
-
 Three Stratum Theory.png 960 × 720; 189 KB
-
 Tre-stratum Teorien.png 757 × 346; 38 KB
-
 UNECE Germany 2010.gif 429 × 615; 23 KB
-
 Uniform DIF curve.png 777 × 669; 19 KB
-
 Visueel analoge schaal.gif 965 × 157; 9 KB
-
 Wechsler.svg 2.142 × 2.060; 106 KB
-
 Yr 2017-12-07 qsort phase 1.png 953 × 523; 54 KB
-
 Z sten.svg 512 × 259; 30 KB
-
 Échelle sémantique différentielle d'Osgood.png 557 × 133; 6 KB


_coefficients.png)


.svg)


_example.gif)


