Category:Intelligence quotient
Jump to navigation
Jump to search
score derived from tests purported to measure individual differences  | |||||
| Upload media | |||||
| Instance of |
| ||||
|---|---|---|---|---|---|
| |||||
Subcategories
This category has the following 8 subcategories, out of 8 total.
Media in category "Intelligence quotient"
The following 59 files are in this category, out of 59 total.
-
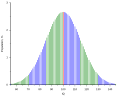
 Alcohol IQ Graph.jpg 800 × 600; 171 KB
-
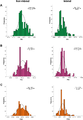
 Asperger Syndrome hist.svg 504 × 495; 28 KB
-
 Beratt.png 819 × 460; 11 KB
-
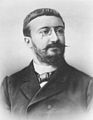 Alfred Binet.jpg 2,188 × 2,812; 721 KB
-
 Blood lead level and IQ loss from lead exposure in early childhood.jpg 2,835 × 1,257; 164 KB
-
 Carroll three stratum.svg 904 × 443; 122 KB
-
 Cellular basis of IQ.png 912 × 1,103; 548 KB
-
 Cognitive abilities among inbred and non-inbred children.png 2,204 × 3,320; 580 KB
-
 Collective IQ is just IQ SEM.png 783 × 1,016; 103 KB
-

-
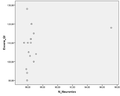 Dispersão de QI x Número de neurônios.png 567 × 453; 19 KB
-
 Distribuzione gaussiana dell'intelligenza.jpg 1,288 × 1,022; 83 KB
-
 Excel IQ EwB Chart.jpg 508 × 320; 62 KB
-
 Flynn Effect.jpg 790 × 768; 229 KB
-
 Flynn effect.png 1,079 × 594; 40 KB
-
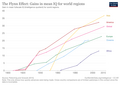
 Flynn-–-World-Regions.png 750 × 477; 104 KB
-
 Full scale IQ comparisons in respect to the degree of inbreeding.png 2,910 × 1,389; 346 KB
-
 Gausse-kromme over hoog en laagbegaafdheid2.PNG 415 × 447; 8 KB
-
 Genes of reading- and language-related traits largely independent of performance IQ.jpg 2,918 × 2,865; 910 KB
-
 Genetic correlation results about traits, IQ and language skills.jpg 2,920 × 3,875; 1.22 MB
-
 Genetic variants associated with IQ.png 1,412 × 850; 340 KB
-
 Gray matter thickness of multiple cortical areas correlates with IQ.png 917 × 837; 380 KB
-
 Heaton School Board Journal April 1922 Cover.png 612 × 716; 516 KB
-
 Hi IQ, Jimma, Ethiopia (11512999094).jpg 4,016 × 6,016; 799 KB
-

-
 How Much Can We Boost IQ and Scholarly Achievement (transcript, page 2).jpg 1,081 × 1,533; 569 KB
-
 Inbreeding depression on cognitive abilities.png 2,881 × 2,195; 208 KB
-
 InvertedIQbyCountry.png 1,800 × 820; 184 KB
-
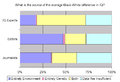
 IQ AND THE WEALTH NATIONS.jpg 575 × 830; 204 KB
-
 IQ curve (2).svg 600 × 480; 9 KB
-
 IQ curve.png 781 × 491; 7 KB
-
 IQ curve.svg 600 × 480; 9 KB
-
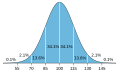 IQ distribution.svg 284 × 171; 15 KB
-
 IQ Distributions and Occupations.jpg 1,028 × 765; 131 KB
-
 IQ Testing Get Your IQ Result Right Now.jpg 808 × 808; 108 KB
-
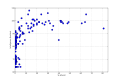
 IQ vs GDP per capita.png 4,837 × 2,135; 705 KB
-
 IQ по Штерну.png 1,139 × 132; 30 KB
-
 Iq-symbol.svg 47 × 47; 758 bytes
-
 IQatWoN GDP IQ.png 2,000 × 1,309; 43 KB
-
 IQEQ.JPG 640 × 314; 17 KB
-
 LynnHarveyNyborg-Atheism-IQ.svg 1,080 × 720; 58 KB
-
 LynnHarveyNyborg-CountryBelieveGod-Intelligence-HUN.svg 1,080 × 720; 73 KB
-
 LynnHarveyNyborg-CountryBelieveGod-Intelligence.svg 1,080 × 720; 75 KB
-
-
 Ourworldindata wisc-iq-gains-over-time-flynn-2007.png 1,163 × 878; 28 KB
-
 Relationship between Bipolar Disorders and IQ.jpg 547 × 600; 106 KB
-
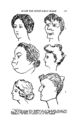 Simon-Binet Ugly Face Item from 1911 journal.png 3,526 × 5,350; 334 KB
-
 Snyderman-rothman.png 1,055 × 720; 26 KB
-
 SpearmanFactors.svg 400 × 400; 1,015 bytes
-
 Sundet et al 2004 fig 3.svg 512 × 301; 19 KB
-
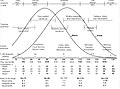
 Terman1916Fig2IQDistribution.png 795 × 422; 15 KB
-
 The-Flynn-Effect.webp 2,046 × 1,444; 146 KB
-
 Theodore Simon ACERVO CDPHA.jpg 213 × 243; 13 KB
-
 To Nota Bene of Kaspersky Lab.jpg 1,111 × 1,242; 427 KB
-
 WAIS-IV FSIQ Scores by Race and Ethnicity.png 1,000 × 600; 87 KB
-
 Wechsler Adult Intelligence Scale subscores and subtests.png 984 × 684; 50 KB
-
 Wechsler Adult Intelligence Scale subscores and subtests.svg 1,908 × 1,296; 7 KB
-
 Wechsler Intelligence Scale for Children WISC-III NL.JPG 3,968 × 2,976; 2.56 MB
-


.jpg)


.svg)


.jpg)