Category:Psychometrics
Aller à la navigation
Aller à la recherche
étude de l'ensemble des techniques de mesures pratiquées en psychologie _b_264.jpg) | |||||
| Téléverser des médias | |||||
| Nature de l’élément | |||||
|---|---|---|---|---|---|
| Sous-classe de | |||||
| À ne pas confondre avec | |||||
| Coïncide partiellement avec |
| ||||
| |||||
Sous-catégories
Cette catégorie comprend 9 sous-catégories, dont les 9 ci-dessous.
Pages dans la catégorie « Psychometrics »
Cette catégorie comprend seulement la page ci-dessous.
Média dans la catégorie « Psychometrics »
Cette catégorie comprend 97 fichiers, dont les 97 ci-dessous.
-
 1995-SAT-vs-Income-Education.png 1 500 × 1 862 ; 39 kio
-
 3 profils.png 819 × 412 ; 74 kio
-
 Attachment Theory Two Dimension Model.png 550 × 400 ; 7 kio
-
 Barnes maze.jpg 476 × 426 ; 133 kio
-
 Best-Worst Scaling.png 2 943 × 845 ; 40 kio
-
 Bio q2.jpg 672 × 504 ; 35 kio
-
 Blacktest score rise.jpg 400 × 310 ; 22 kio
-
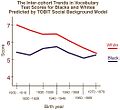 Blackwhite trendbirthyear.jpg 525 × 483 ; 34 kio
-
 Bodźce–stwierdzenia.gif 150 × 100 ; 6 kio
-
 Boussole des couleurs.png 455 × 314 ; 31 kio
-
 Caractéristique Profil Bleu.png 466 × 69 ; 4 kio
-
 Caractéristique Profil Jaune.png 466 × 79 ; 4 kio
-
 Caractéristique Profil Rouge.png 462 × 65 ; 4 kio
-
 Caractéristique Profil Vert.png 466 × 68 ; 3 kio
-
 Caractéristiques des couleurs.png 598 × 435 ; 86 kio
-
 Carroll three stratum model of human Intelligence.png 757 × 346 ; 72 kio
-
 Carroll three stratum.svg 904 × 443 ; 122 kio
-
 Cda sur iris.jpg 762 × 532 ; 49 kio
-
 Chabris2007a.svg 696 × 532 ; 43 kio
-

-
 Congeneric measurement model.png 1 000 × 800 ; 45 kio
-
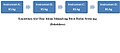
 Content mapping for GBI parcels onto the 7 Up-7 Down scales.png 1 592 × 1 424 ; 114 kio
-
 Content mapping for GBI parcels--10 item Mania and Depression forms.png 1 672 × 1 414 ; 163 kio
-
 CPCs.png 640 × 289 ; 97 kio
-
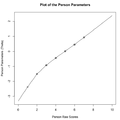 DichotomeRaschExample01 Wikibooks.png 583 × 582 ; 24 kio
-
 DichotomeRaschExample02 Wikibooks.png 577 × 585 ; 35 kio
-
 DichotomeRaschExample03 Wikibooks.png 575 × 585 ; 60 kio
-
 Dwenda cook medley hostility scale graph 1.jpg 902 × 527 ; 44 kio
-
 Dwenda cook medley hostility scale graph 2.jpg 1 502 × 658 ; 126 kio
-
 Eq tests.PNG 657 × 353 ; 10 kio
-
 Evalmatic-machine-professor-peter-saville.jpg 1 200 × 657 ; 421 kio
-
 FactorAnalysis SimpleModel.png 1 033 × 392 ; 25 kio
-
 Grafik potrebnostey.jpg 731 × 760 ; 87 kio
-
 Guilfords cube.png 833 × 720 ; 35 kio
-
 ICC slope ip.png 834 × 708 ; 22 kio
-
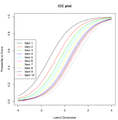
 ICCs prog.png 512 × 235 ; 5 kio
-
 Illogical.png 308 × 249 ; 8 kio
-
 Implicational Lattice.jpg 359 × 137 ; 35 kio
-
 Intelligence for children in Jiangxi province, 1930.png 2 917 × 3 981 ; 160 kio
-
 INTER-NDA Standards Chart.png 1 106 × 1 559 ; 238 kio
-
 IQ curve (2).svg 600 × 480 ; 9 kio
-
 IQ curve.svg 600 × 480 ; 9 kio
-
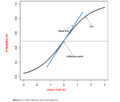
 ItemCharacteristicCurve.png 881 × 693 ; 12 kio
-
 Kh beh depr 00-09 gbe-bund.png 1 736 × 1 639 ; 336 kio
-
 Likert scale.png 1 148 × 268 ; 23 kio
-
 LinkCorrelation1.png 254 × 77 ; 1 kio
-
 LinkCorrelation2.png 214 × 191 ; 2 kio
-
 LinkCorrelation3.png 290 × 157 ; 3 kio
-
 Matrice delle componenti.JPG 282 × 120 ; 10 kio
-
 Matrice di correlazione.jpg 625 × 125 ; 19 kio
-
 Matt's PhD Study.jpg 3 072 × 2 304 ; 2,35 Mio
-
 MHDIFTable.png 1 415 × 568 ; 32 kio
-
 Moral-foundations-value-correlation.svg 540 × 360 ; 38 kio
-
 MTMM model v2.PNG 922 × 692 ; 101 kio
-
 MTMM model.PNG 922 × 692 ; 101 kio
-
 Multi-Trait, Multi-Method (MTMM) example.gif 1 008 × 720 ; 55 kio
-
 Nonuni DIF ICC.png 715 × 675 ; 17 kio
-
 NonuniformDIF.png 765 × 646 ; 19 kio
-
 Numerische Rating-Skala.png 794 × 140 ; 11 kio
-
 Ocena 360 stopni.png 640 × 640 ; 141 kio
-
 PEBLTowerOfLondon.png 626 × 531 ; 14 kio
-
 PerceptualMap1.png 343 × 256 ; 11 kio
-
 PerceptualMap2.png 373 × 268 ; 6 kio
-
 PersItm.PNG 785 × 397 ; 20 kio
-
 Pic5.ahm.JPG 488 × 520 ; 44 kio
-
 Pic6.ahm.JPG 628 × 398 ; 27 kio
-
 Professor-Peter-Saville-Brochures-graphic-design.jpg 1 457 × 1 080 ; 1,06 Mio
-
 Psychometrist tests trainees in a compression chamber.jpg 734 × 486 ; 323 kio
-
 Psychometry.jpg 586 × 878 ; 104 kio
-
 Psychopy.png 256 × 256 ; 50 kio
-
 RaschICC.gif 588 × 271 ; 3 kio
-
 Reakcje–wypowiedzi.gif 150 × 100 ; 6 kio
-
 Reliabilitas.JPG 683 × 300 ; 16 kio
-
 Reliability of the 7 Down depression form based on Item Response Theory.png 1 783 × 976 ; 69 kio
-
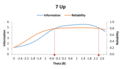 Reliability of the 7 Up mania form based on Item Response Theory.png 1 822 × 1 043 ; 66 kio
-
 Reliability of the GBI Depression 10 item form A, based on Item Response Theory.png 1 861 × 1 018 ; 74 kio
-
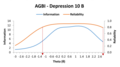 Reliability of the GBI Depression 10 item form B, based on Item Response Theory.png 1 853 × 1 034 ; 74 kio
-

-
 Rook crowding smoothed.JPG 614 × 433 ; 34 kio
-

-
 SpearmanFactors.png 200 × 200 ; 3 kio
-
 SpearmanFactors.svg 400 × 400 ; 1 015 octet
-
 Standard ten scale-example.png 1 269 × 662 ; 9 kio
-
 Strategia psychometryczna – wartościowanie deklaracyjne.gif 150 × 100 ; 6 kio
-
 Tabl potrebnostey.jpg 792 × 761 ; 159 kio
-
 Tautological Lattice.jpg 358 × 116 ; 42 kio
-
 TCC.PNG 657 × 353 ; 7 kio
-
 Teoria dels Estrats de J.B .Carroll.png 378 × 145 ; 10 kio
-
 Three Stratum Theory.png 960 × 720 ; 189 kio
-
 Tre-stratum Teorien.png 757 × 346 ; 38 kio
-
 UNECE Germany 2010.gif 429 × 615 ; 23 kio
-
 Uniform DIF curve.png 777 × 669 ; 19 kio
-
 Visueel analoge schaal.gif 965 × 157 ; 9 kio
-
 Wechsler.svg 2 142 × 2 060 ; 106 kio
-
 Yr 2017-12-07 qsort phase 1.png 953 × 523 ; 54 kio
-
 Z sten.svg 512 × 259 ; 30 kio
-
 Échelle sémantique différentielle d'Osgood.png 557 × 133 ; 6 kio


_coefficients.png)


.svg)


_example.gif)


