Category:Sea surface temperature maps
Salti al navigilo
Salti al serĉilo
| NENIU VIKIDATUMOJ-IDENTIGILO TROVITA! Serĉi Sea surface temperature maps ĉe Vikidatumoj | |
| Alŝuti plurmedion |
- NASA 2002-2015: temperatures
- NASA 2002-2011: temperature anomalies
Subkategorioj
Ĉi tiu kategorio havas la 2 jenajn subkategoriojn, el 2 entute.
2
Dosieroj en kategorio “Sea surface temperature maps”
La jenaj 171 dosieroj estas en ĉi tiu kategorio, el 171 entute.
-
 Meyers b2 s0003 b2.png 380 × 460; 87 KB
-
 Meyers b2 s0003 b3.png 380 × 460; 86 KB
-
 Ocean surface temperature averages El Nino 1982-83.gif 825 × 360; 49 KB
-
 Global Sea Surface Temperature - GPN-2003-00032.jpg 2 876 × 1 440; 5,31 MB
-
 Hurricane Bob Sea Surface Temperature Difference.jpg 500 × 600; 55 KB
-
 Pre-Hurricane Bob Sea Surface Temperature.jpg 500 × 600; 38 KB
-
 Post Hurricane Bob Sea Surface Temperature.jpg 500 × 600; 36 KB
-
 SeaSurfaceTopography Atlantic.gif 534 × 671; 38 KB
-
 El-Nino-secheresse.pdf 1 370 × 660; 87 KB
-
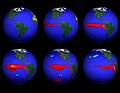
 Movement of surface waters during El Nino.jpg 2 512 × 1 286; 330 KB
-
 Comparing Sea Level During El Niño Events (PIA26099).jpg 1 586 × 783; 589 KB
-
 El-nino.png 576 × 277; 113 KB
-
 Nino.gif 308 × 133; 8 KB
-
 1997 El Nino TOPEX.jpg 2 550 × 2 548; 556 KB
-
 Avhrr-sea.png 540 × 330; 81 KB
-
 Sst 9798 animated.gif 432 × 282; 876 KB
-
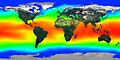
 SurfaceTemperature.jpg 600 × 300; 54 KB
-
 Sea surface temperature 2001.png 1 550 × 1 075; 197 KB
-
 Modis brighttemp glfstr lrg.jpg 1 100 × 850; 190 KB
-
 Atlantic2 amsre 2005216.jpg 540 × 450; 101 KB
-
 WOA05 sea-surf TMP AYool.png 1 637 × 1 133; 305 KB
-
 Katrina sstTracksSTILL.20050829-1.jpg 2 560 × 1 920; 3,67 MB
-
 NASA ASMR-E image of average SSTs of Hurricane Katrina.jpg 720 × 576; 467 KB
-
 Sstaanim.gif 486 × 234; 113 KB
-
 LaNina Pacific 2006JanFeb.jpg 540 × 465; 109 KB
-
 Sea Surface Temperature - November 2007.jpg 1 440 × 720; 669 KB
-
 La Nina and Pacific Decadal Anomalies - April 2008.png 709 × 553; 487 KB
-
 Arctic ocean SST and ice edge.png 1 719 × 1 768; 1,15 MB
-
 WOA09 sea-surf TMP AYool.png 3 183 × 2 192; 179 KB
-
 Температура воды Баренцево море январь 2009.jpg 1 196 × 813; 247 KB
-
 Temperature variation in the Northern Channel Islands.jpg 1 155 × 837; 183 KB
-
 Weeklysst.gif 800 × 510; 70 KB
-
 AMO Pattern.png 3 315 × 1 681; 2,16 MB
-
 2014 Annual Temperature Local Records.jpg 2 700 × 1 555; 773 KB
-
 2015 Annual Temperature Local Records.jpg 2 509 × 1 446; 929 KB
-
2022 Hurricane Season (SVS5097 - hurr2022 v6 2160p30).webm 4 min 27 s, 2 160 × 2 160; 107,65 MB
-
2022 Hurricane Season (SVS5097 - hurr2022 v6 4hw 2160p30).webm 4 min 27 s, 3 840 × 2 160; 221,68 MB
-

-
 ADEOS-OCTS.gif 660 × 878; 125 KB
-
 Atlantic Meridional Overturning Circulation at weakest point in a millennium.jpg 3 516 × 2 346; 1,17 MB
-

-
 Circulation de Walker.png 590 × 413; 18 KB
-
 Circulation El Nino-(el).PNG 606 × 413; 19 KB
-
 Circulation El Nino.png 608 × 413; 16 KB
-
 Circulation La Nina-(el).PNG 606 × 413; 19 KB
-
 Circulation La Nina.png 606 × 413; 17 KB
-
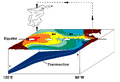
 ENSO - El Niño-cs.svg 512 × 394; 22 KB
-
 ENSO - El Niño.svg 512 × 394; 21 KB
-
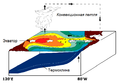
 ENSO - La Niña-cs.svg 240 × 185; 22 KB
-
 ENSO - La Niña.svg 240 × 185; 21 KB
-
 ENSO - normal-cs.svg 370 × 285; 23 KB
-
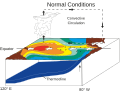 ENSO - normal.svg 370 × 285; 22 KB
-
 Enso elnino.png 608 × 413; 17 KB
-
 Enso lanina.png 606 × 413; 18 KB
-
 Enso normal-el.PNG 606 × 413; 20 KB
-
 Enso normal.png 590 × 413; 19 KB
-
 Pacific Ocean ru.png 590 × 413; 19 KB
-
 CLIMAP.jpg 650 × 472; 124 KB
-
 Cloud-free view and sea surface temperature of the Adriatic Sea, Europe.jpg 3 820 × 2 540; 4,72 MB
-
 CPC-NWS-NOAA SST Anoms 08 JUL 2015.png 500 × 225; 98 KB
-
 EB1911 Plankton - Atlantic surface isotherms.jpg 773 × 1 122; 363 KB
-
 Ecuador térmico.png 525 × 500; 30 KB
-
-
 El Niño, Dic 1997.png 447 × 281; 65 KB
-
 ENSO - El Niño-th.svg 512 × 394; 24 KB
-
 ENSO - La Niña-th.svg 240 × 185; 24 KB
-
 ENSO - normal-th.svg 370 × 285; 25 KB
-
 Envisat view of Bay of Biscay ESA232549.jpg 1 044 × 1 654; 757 KB
-
 Envisat view of Bay of Biscay ESA232549.tiff 1 354 × 2 126; 4,68 MB
-
 ERN Jason3 hurricane rect (24523537872).png 911 × 512; 618 KB
-
 ERN Jason3 hurricane square (24336351140).png 640 × 640; 496 KB
-
 Full global of the sea surface temperature (June 28, 2018).gif 1 174 × 640; 229 KB
-
 Golfstrom.jpg 363 × 363; 53 KB
-
 Great Barrier Reef Sea Surface Temperature Anomaly 20240304.jpg 720 × 545; 306 KB
-
 Gulf Oil Slick Approaching Loop Current MODIS.png 720 × 360; 323 KB
-
 Gulf Stream Surface Temperature Map.gif 540 × 360; 39 KB
-
 Gulf Stream water temperature.jpg 538 × 566; 438 KB
-
 GulfMexTemps 2005Hurricanes-zh.png 1 215 × 931; 51 KB
-
 Heatwaves affect the Mediterranean Sea.jpg 4 400 × 2 540; 2,36 MB
-
 High resoulution contour chart of the global Sea Surface Temperature-Colored.gif 9 000 × 6 000; 4,11 MB
-
 High resoulution contour chart of the global Sea Surface Temperature-Contoured.gif 9 000 × 6 000; 4,28 MB
-
 High resoulution contour chart of the global Sea Surface Temperature.gif 9 000 × 6 000; 963 KB
-
 Hurricane Alley.jpg 2 560 × 1 920; 371 KB
-
Hurricane Wilma.ogv 13 s, 480 × 320; 2,53 MB
-
 Lajolla crw 2018214 lrg.jpg 7 015 × 4 960; 4 MB
-
 Lajolla crw 2018214.jpg 720 × 543; 252 KB
-
 Lake Ontario temperature ESA23534764.jpeg 1 920 × 1 440; 3,37 MB
-
 Land and ocean temperature anomalies, February 2013.gif 580 × 448; 68 KB
-
 Mean sst equatorial pacific.gif 432 × 645; 24 KB
-
 Mediterranean Sea Surface Temperature at the end of August.jpg 4 000 × 2 533; 2,54 MB
-
 Mediterranean Sea temperature at 2022-07-24.png 945 × 447; 237 KB
-
 Mixed layer depth seasonal cycle.png 2 721 × 1 504; 1,91 MB
-
 MODIS sst.png 2 205 × 1 229; 1,51 MB
-
 NASA Hot water ahead for Hurricane Irma.jpg 768 × 581; 270 KB
-
 Nepac sst oper0-Temp-sup-Oc-Pacífico-16-sep-2013.png 1 024 × 768; 160 KB
-
 Nicole am2 2016290.jpg 720 × 540; 161 KB
-
 Niña costera de 2018.png 453 × 501; 66 KB
-
-
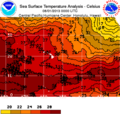
 NOAA-CPC-NWS-NOAA SST Anoms 2015.jpg 920 × 596; 73 KB
-
 North Atlantic Temp Section 30N.gif 649 × 560; 21 KB
-
 Ocean Surface Temperatures (16458993963).jpg 5 836 × 3 072; 7,67 MB
-
 Ocean warming continues in 2021 (Copernicus).jpg 4 409 × 2 540; 1,93 MB
-
 OceanTemps AMSRE 18sep05.jpg 1 440 × 730; 195 KB
-
 Pacific SST anomaly 06-27-2019.gif 930 × 580; 168 KB
-
 Pacific SST anomaly 10-15-2015.gif 930 × 580; 126 KB
-
 Pliocene sst anomaly.png 2 721 × 1 496; 1,03 MB
-
 Podaac blob colordata sst2015.jpg 900 × 1 066; 267 KB
-
 Recent marine heatwaves.png 3 450 × 1 980; 480 KB
-
-
 Sea Surface Temperature (Eastern Pacific on June 2018).gif 930 × 580; 163 KB
-
-
-
-
 Sea Surface Temperature anomaly in the Mediterranean.jpg 4 000 × 2 533; 2,51 MB
-
 Sea Surface Temperature in the Mediterranean affected by heatwave in southwestern Europe.jpg 4 408 × 2 540; 2,55 MB
-
 Sea Surface Temperature of the Baltic Sea, Kattegat and Skagerrak.jpg 3 535 × 2 563; 1,7 MB
-

-
 Sea surface Temperatures SST anomalies 1982 2016 en.png 1 898 × 1 178; 1,15 MB
-
 Sea surface Temperatures SST anomalies 1982 2016 fr.png 1 898 × 1 178; 1,1 MB
-
 Shindell&Schmidt Observed and modeled Dec–May SH trends.png 600 × 575; 259 KB
-
 Southern Hemisphere Sea Surface Temperatures, 1970 (50700829562).jpg 800 × 697; 300 KB
-
 Sst dayly.png 877 × 720; 236 KB
-
 SST Gulf stream.jpeg 1 445 × 889; 539 KB
-
 SST Map for May 2, 2012.jpg 11 637 × 6 286; 31,77 MB
-
 SST of N Atlantic with Florence's chance.png 720 × 545; 346 KB
-
 Sst reemergence.png 838 × 828; 182 KB
-
 Sstanom 199711 krig.jpg 350 × 219; 19 KB
-
 Sstdailyanom20160101.gif 800 × 510; 101 KB
-
 SSTm.png 3 600 × 1 800; 542 KB
-
 SSTs.png 3 600 × 1 800; 1,18 MB
-
 Temp july2010.png 720 × 539; 147 KB
-

-
 Température de la mer janvier 2009.png 457 × 610; 84 KB
-
 The Blob NOAA April 2014.jpg 552 × 376; 45 KB
-

-
 The HoloGlobe Project (Version 3) (SVS155 - cloud motion ortho).jpg 720 × 486; 63 KB
-
 The HoloGlobe Project (Version 3) (SVS155 - cloud motion).jpg 1 024 × 512; 187 KB
-
 The HoloGlobe Project (Version 3) (SVS155 - composite 2).jpg 1 024 × 768; 147 KB
-
 The HoloGlobe Project (Version 3) (SVS155 - composite).jpg 955 × 406; 91 KB
-

-
-
 The HoloGlobe Project (Version 3) (SVS155 - crustal dynamics).jpg 1 024 × 512; 267 KB
-
 The HoloGlobe Project (Version 3) (SVS155 - earth night africa).jpg 720 × 486; 36 KB
-

-
 The HoloGlobe Project (Version 3) (SVS155 - earth night asia).jpg 720 × 486; 27 KB
-
 The HoloGlobe Project (Version 3) (SVS155 - earth night).jpg 1 024 × 512; 79 KB
-

-
 The HoloGlobe Project (Version 3) (SVS155 - earth noclouds).jpg 1 024 × 512; 103 KB
-
 The HoloGlobe Project (Version 3) (SVS155 - earthquakes globe).jpg 720 × 486; 65 KB
-
 The HoloGlobe Project (Version 3) (SVS155 - earthquakes).jpg 1 024 × 512; 265 KB
-
 The HoloGlobe Project (Version 3) (SVS155 - elnino sequence).jpg 1 584 × 1 224; 179 KB
-
 The HoloGlobe Project (Version 3) (SVS155 - elnino).jpg 640 × 480; 31 KB
-
 The HoloGlobe Project (Version 3) (SVS155 - galileo earth proj).jpg 1 024 × 512; 123 KB
-
 The HoloGlobe Project (Version 3) (SVS155 - galileo earth).jpg 1 024 × 768; 99 KB
-
 The HoloGlobe Project (Version 3) (SVS155 - ocean drain sequence).jpg 1 024 × 768; 109 KB
-
 The HoloGlobe Project (Version 3) (SVS155 - ocean drain).jpg 540 × 540; 50 KB
-

-
 The HoloGlobe Project (Version 3) (SVS155 - plate boundaries).jpg 1 024 × 512; 236 KB
-
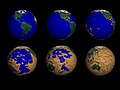
 The HoloGlobe Project (Version 3) (SVS155 - seasurftemp globe).jpg 720 × 486; 43 KB
-
 The HoloGlobe Project (Version 3) (SVS155 - seasurftemp).jpg 1 024 × 512; 130 KB
-
 The HoloGlobe Project (Version 3) (SVS155 - vegetation seasons).jpg 2 132 × 2 132; 606 KB
-
 The HoloGlobe Project (Version 3) (SVS155 - vegetation).jpg 520 × 480; 46 KB
-
 The HoloGlobe Project (Version 3) (SVS155 - volcanoes globe).jpg 720 × 486; 62 KB
-
 The HoloGlobe Project (Version 3) (SVS155 - watervapor).jpg 1 080 × 1 080; 150 KB
-
The HoloGlobe Project (Version 3) (SVS155).webm 6 min 21 s, 321 × 240; 65,62 MB
-
 The Mediterranean Sea is still heavily affected by the extreme temperatures.jpg 4 000 × 2 533; 2,19 MB
-
 Third La Niña event in a row in the Pacific Ocean.png 4 007 × 4 007; 11,15 MB
-
Tour of the Galapagos.ogv 2 min 31 s, 1 280 × 720; 33,33 MB
-
 Tropical instability waves example.jpg 640 × 480; 81 KB
-
 Water temperature off the California coastline.jpg 600 × 503; 64 KB
-
 WorldwideTCpeaks.gif 354 × 221; 26 KB


.jpg)


.PNG)

.PNG)


.png)
.png)
.gif)


,_FEB_2015.jpg)


.jpg)
.jpg)


.gif)
_-_Near_Real_Time_(SVS5101_-_sst_mur_most_recent_print).jpg)
_-_Near_Real_Time_(SVS5101_-_sst_mur_no-dates_most_recent_print).jpg)
_-_Near_Real_Time_(SVS5101_-_sst_mur_robinson_most_recent_print).jpg)


.jpg)


.jpg)


,_grande_diff%C3%A9rence_jusqu%27%C3%A0_5%C2%B0C_de_l%27eau.png)


.jpg)
_(SVS155_-_cloud_motion_ortho).jpg)
_(SVS155_-_cloud_motion).jpg)
_(SVS155_-_composite_2).jpg)
_(SVS155_-_composite).jpg)
_(SVS155_-_crustal_dynamics_globe).jpg)
_(SVS155_-_crustal_dynamics_hologlobe).jpg)
_(SVS155_-_crustal_dynamics).jpg)
_(SVS155_-_earth_night_africa).jpg)
_(SVS155_-_earth_night_americas).jpg)
_(SVS155_-_earth_night_asia).jpg)
_(SVS155_-_earth_night).jpg)
_(SVS155_-_earth_noclouds_globe).jpg)
_(SVS155_-_earth_noclouds).jpg)
_(SVS155_-_earthquakes_globe).jpg)
_(SVS155_-_earthquakes).jpg)
_(SVS155_-_elnino_sequence).jpg)
_(SVS155_-_elnino).jpg)
_(SVS155_-_galileo_earth_proj).jpg)
_(SVS155_-_galileo_earth).jpg)
_(SVS155_-_ocean_drain_sequence).jpg)
_(SVS155_-_ocean_drain).jpg)
_(SVS155_-_plate_boundaries_globe).jpg)
_(SVS155_-_plate_boundaries).jpg)
_(SVS155_-_seasurftemp_globe).jpg)
_(SVS155_-_seasurftemp).jpg)
_(SVS155_-_vegetation_seasons).jpg)
_(SVS155_-_vegetation).jpg)
_(SVS155_-_volcanoes_globe).jpg)
_(SVS155_-_watervapor).jpg)


