Category:Traffic engineering
Zur Navigation springen
Zur Suche springen
technisches Fachgebiet | |||||
| Medium hochladen | |||||
| Aussprache (Audiodatei) | |||||
|---|---|---|---|---|---|
| Ist ein(e) | |||||
| Unterklasse von | |||||
| |||||
Files related to traffic engineering, i.e. engineering related to en:traffic. This is distinct from the broader parent category.
Unterkategorien
Es werden 6 von insgesamt 6 Unterkategorien in dieser Kategorie angezeigt:
In Klammern die Anzahl der enthaltenen Kategorien (K), Seiten (S), Dateien (D)
Medien in der Kategorie „Traffic engineering“
Folgende 134 Dateien sind in dieser Kategorie, von 134 insgesamt.
-
 3ptt de 2d plane adaptation.png 4.796 × 1.567; 156 KB
-
 3ptt de adaptation.png 2.547 × 1.918; 160 KB
-
 3ptt de asda foto pattern.png 384 × 655; 114 KB
-
 3ptt de flow congested.png 235 × 178; 23 KB
-
 3ptt de flow free.png 236 × 179; 17 KB
-
 3ptt de measurements.png 436 × 657; 109 KB
-
 3ptt de traffic breakdown.png 227 × 198; 11 KB
-
 3ptt de traffic capacity.png 323 × 156; 18 KB
-
 3ptt de traffic flow density plane.png 362 × 181; 30 KB
-
 3ptt de traffic pattern.png 316 × 278; 36 KB
-
 3ptt en 2d plane adaptation.png 4.793 × 1.575; 136 KB
-
 3ptt en adaptation.png 2.492 × 1.711; 120 KB
-
 3ptt en asda foto pattern.png 422 × 613; 139 KB
-
 3ptt en traffic breakdown.png 181 × 160; 9 KB
-
 3ptt en traffic capacity.png 1.343 × 769; 94 KB
-
 3ptt en traffic flow density plane.png 322 × 159; 26 KB
-
 3ptt en traffic pattern.png 413 × 364; 44 KB
-
 3ptt es 2d plane adaptation.png 4.793 × 1.575; 98 KB
-
 3ptt es adaptation.png 2.492 × 1.711; 68 KB
-
 3ptt es asda foto pattern.png 488 × 700; 116 KB
-
 3ptt es flow congested.png 284 × 188; 15 KB
-
 3ptt es measurements.png 726 × 695; 109 KB
-
 3ptt es traffic breakdown.png 210 × 170; 10 KB
-
 3ptt es traffic capacity.png 260 × 160; 11 KB
-
 3ptt es traffic flow density plane.png 360 × 190; 24 KB
-
 3ptt es traffic pattern.png 450 × 400; 47 KB
-
 3ptt pt asda foto pattern.png 460 × 641; 120 KB
-
 3ptt pt flow congested.png 290 × 190; 21 KB
-
 3ptt pt flow free.png 243 × 196; 14 KB
-
 3ptt pt measurements.png 726 × 695; 106 KB
-
 3ptt pt traffic breakdown.png 210 × 170; 9 KB
-
 3ptt pt traffic capacity.png 260 × 160; 9 KB
-
 3ptt pt traffic flow density plane.png 360 × 190; 21 KB
-
 3ptt pt traffic pattern.png 450 × 400; 42 KB
-
 3ptt ru asda foto pattern.png 2.372 × 3.353; 82 KB
-
 3ptt ru flow congested.png 895 × 745; 15 KB
-
 3ptt ru flow free.png 782 × 718; 12 KB
-
 3ptt ru measurements.png 2.002 × 3.304; 557 KB
-
 3ptt ru traffic breakdown.png 1.101 × 965; 32 KB
-
 3ptt ru traffic capacity.png 1.357 × 907; 49 KB
-
 3ptt ru traffic flow density plane.png 1.624 × 962; 88 KB
-
 3ptt ru traffic pattern.png 1.577 × 1.407; 177 KB
-
 4 step model for traffic assignment.png 1.500 × 1.128; 42 KB
-
 A Short History of Traffic Engineering.jpg 3.859 × 4.209; 1,03 MB
-
 Active Inactive Moving Bottleneck1.PNG 144 × 327; 6 KB
-
 ADDVOL Model results.jpg 941 × 553; 132 KB
-
 AKF1-ACundD.png 349 × 319; 4 KB
-
 AKF1-AundD.png 344 × 306; 3 KB
-
 AKF1-Kreuzung.png 420 × 328; 4 KB
-
 Arrival, Virtual Arrival, and Departure Curves.png 923 × 456; 51 KB
-
 Asda de 1 patterns.png 1.500 × 2.358; 257 KB
-
 Asda de 2 phases.png 1.200 × 701; 44 KB
-
 Asda de 3 asda model.png 1.200 × 1.189; 39 KB
-
 Asda de 4 measurements.png 1.400 × 1.332; 134 KB
-
 Asda de 5 traveltime.png 1.500 × 560; 98 KB
-
 Asda en 1 patterns.png 1.500 × 2.457; 225 KB
-
 Asda en 2 phases.png 3.016 × 1.783; 212 KB
-
 Asda en 3 asda model.png 2.091 × 1.376; 98 KB
-
 Asda en 4 measurements.png 2.350 × 2.191; 392 KB
-
 Asda en 5 traveltime.png 541 × 211; 40 KB
-
 Asda es 1 patterns.jpg 1.500 × 2.358; 1,78 MB
-
 Asda es 3 asda model.jpg 4.357 × 4.316; 5,02 MB
-
 Asda es 4 measurements.jpg 5.132 × 4.882; 5,04 MB
-
 Asda es 5 traveltime.jpg 2.615 × 976; 1,05 MB
-
 Aussenverkehr.svg 300 × 300; 5 KB
-
 Binnenverkehr.svg 300 × 300; 5 KB
-
 Braess.jpg 1.777 × 1.280; 204 KB
-
 Braess22.jpg 1.754 × 437; 35 KB
-
 Bruttozeitlücke.jpg 575 × 175; 19 KB
-
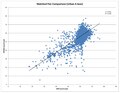 Comparison between INRIX and NPMRDS Data on 6-lane Urban Freeway.pdf 1.650 × 1.275; 294 KB
-
 Data Availability for 6-lane Urban Freeway in January.pdf 1.650 × 1.275; 164 KB
-
 Data Availability on 4-lane Inter-regional Freeway in January.pdf 1.650 × 1.275; 166 KB
-
 Diagonalsperre.jpg 529 × 529; 38 KB
-
 Durchgangsverkehr.svg 300 × 300; 4 KB
-
 ESCENARIO(MIO)3MODIFI.JPG 474 × 168; 25 KB
-
 Explanations of the fundamental empirical features of traffic breakdown.png 2.314 × 3.136; 653 KB
-
 Fundamental empirical features of traffic breakdown.png 1.689 × 1.194; 92 KB
-
 Gebrochener Durchgangsverkehr.svg 300 × 300; 4 KB
-
Hoe kunnen steden autoverkeer verminderen.webm 4 min 14 s, 1.920 × 1.080; 53,05 MB
-
 Incident plots.PNG 1.536 × 690; 60 KB
-
 Iris data collection 1KHz reid loop data.jpg 1.904 × 900; 261 KB
-
 Itavayla-Herttoniemi-2017.jpg 2.136 × 1.602; 1,74 MB
-
 Jughandle Intersection.gif 590 × 823; 28 KB
-
 Makati intersection.jpg 1.024 × 768; 93 KB
-
 Max queue delay.png 890 × 504; 66 KB
-
 MB1.PNG 539 × 323; 13 KB
-
 Nagatacho(Y) traffic info display.jpg 1.800 × 2.400; 639 KB
-
 NaSchIllustration black.png 700 × 500; 6 KB
-
 NaSchIllustration white.png 700 × 500; 6 KB
-
 NaSchIllustration2 black.png 700 × 500; 6 KB
-
 NaSchIllustration2 white.png 700 × 500; 6 KB
-
 Nettozeitlücke.jpg 575 × 175; 9 KB
-
 Possible trajectories in a turbo roundabout RED.gif 446 × 458; 56 KB
-
 Possible trajectories in a turbo roundabout.gif 446 × 458; 56 KB
-
 Proposed thoroughfare plan for Seattle central business district, 1959.jpg 2.260 × 3.265; 1,12 MB
-
 Quellverkehr.svg 300 × 300; 5 KB
-
 Ramp meter from Miller Park Way to I-94 east in Milwaukee.jpg 600 × 450; 74 KB
-
 Roadway section with bottleneck.png 672 × 310; 19 KB
-
 Rueckfliessender Quellverkehr.svg 300 × 300; 9 KB
-
 Rueckfliessender Zielverkehr.svg 300 × 300; 9 KB
-
 Seattle - Proposed street usage, 1920 (50548096073).jpg 2.493 × 3.153; 559 KB
-
 Showing traffic char.png 895 × 486; 71 KB
-
 Sichtfelder Radwegfurt ERA95.svg 922 × 313; 106 KB
-
 Signallageplan beschriftet.jpg 643 × 509; 109 KB
-
 Simple cumulative curve two.png 781 × 454; 42 KB
-
 Simulations of the BM principle.png 2.446 × 1.484; 375 KB
-
 Spontaneous and induced traffic breakdowns.png 2.681 × 1.106; 653 KB
-
 Step function.png 527 × 296; 17 KB
-
 Sweetspot.png 750 × 546; 41 KB
-
 Time Space Diag Figure 1.JPG 635 × 433; 29 KB
-
 Time Space Diag Figure 2.JPG 680 × 475; 32 KB
-
 Time Space Diag Figure 3.JPG 647 × 443; 32 KB
-
 Time Space Diag Figure 4.JPG 636 × 432; 29 KB
-
 Tractor-OnTheRoad01.jpg 2.304 × 1.728; 2,4 MB
-
 Traditional jughandle.gif 590 × 759; 37 KB
-
 Transims microsimulator.png 1.115 × 827; 495 KB
-
 Transims population synthesizer.png 1.102 × 789; 482 KB
-
 Transims route planner.png 1.115 × 852; 491 KB
-
 Transims.jpg 857 × 767; 59 KB
-
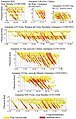
 Travel Times for 4-lane Inter-regional Freeway in July.png 1.447 × 679; 288 KB
-
 Turbokörforgalom irányok.gif 447 × 452; 28 KB
-
 Untersuchungsgebiet mit Verkehrszellen.jpg 2.001 × 1.321; 306 KB
-
 User equilibrium traffic model.jpg 941 × 502; 70 KB
-
 Verkeersmodel simone.JPG 1.024 × 671; 100 KB
-
 Verkehrsart.jpg 758 × 382; 111 KB
-
 Vertical Curve Example 2.JPG 470 × 175; 11 KB
-
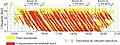
 Weather plots.PNG 1.495 × 726; 60 KB
-
 Wechselverkehrszeichen.jpg 735 × 522; 90 KB
-
 Wendefahrbahn.jpg 240 × 152; 13 KB
-
 Wikipedia TrafficBottlenecks moving1 tsd.svg 432 × 288; 5 KB
-
 Wikipedia TrafficBottlenecks moving1.svg 432 × 288; 9 KB
-
 Wikipedia TrafficBottlenecks regular tsd.svg 432 × 288; 12 KB
-
 Zielverkehr.svg 300 × 300; 4 KB
-
 永田町駅 Traffic Information System.jpg 3.264 × 2.448; 1,05 MB


_traffic_info_display.jpg)


.jpg)


3MODIFI.JPG)