Category:Visualization
ナビゲーションに移動
検索に移動

- (cs) Vizualizace
- (de) Visualisierung
- (en) Visualization
- (es) Visualización
- (lt) Vizualizacija
- (nl) Visualisatie
| Visualization on sister projects: | ||||||||||
|---|---|---|---|---|---|---|---|---|---|---|
Wiktionary |
Wikinews |
Wikiquote |
Wikibooks |
Wikisource |
Wikiversity | |||||

set of techniques for creating images, diagrams, or animations to communicate a message  | |||||
| メディアをアップロード | |||||
| 上位クラス |
| ||||
|---|---|---|---|---|---|
| 以下の一部分 | |||||
| 用途 | |||||
| 以下を含む | |||||
| 以下と異なる | |||||
| |||||
下位カテゴリ
このカテゴリに属する 24 個のサブカテゴリのうち、 24 個を表示しています。
*
A
C
E
- EVA London (12ファイル)
- Exploding head syndrome (1ファイル)
G
I
M
- Marching cubes (6ファイル)
- Marching squares (23ファイル)
- Marching tetrahedrons (2ファイル)
S
V
カテゴリ「Visualization」にあるメディア
このカテゴリに属する 147 個のファイルのうち、 147 個を表示しています。
-
 2 Opt Swaps Visualization.gif 1,000 × 1,000;26.61メガバイト
-
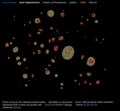
 A portion of the cement hydration data set output from (5884516050).jpg 455 × 417;79キロバイト
-
 Acople visual.png 802 × 541;205キロバイト
-
 Africanconflictancollaboration01.png 679 × 665;29キロバイト
-
 Aid4face2geo - the new look.jpg 1,499 × 1,499;53キロバイト
-
 Alyssa Goodman under the Gaia Stars at New York's Hayden Planetarium.jpg 3,611 × 2,423;2.86メガバイト
-
 Andrews curve for Iris data set.png 1,150 × 742;334キロバイト
-
 Animated LIC.svg 261 × 352;96キロバイト
-
 ArtExhibitionCatalog20080811aSQR.jpg 420 × 420;21キロバイト
-
 ArtExhibitionCatalog20080811bSQR.jpg 355 × 355;17キロバイト
-
-

-
 AV1 2018-03-20 Q63 intra modes rush hour.png 1,024 × 1,024;523キロバイト
-
 Benefitsofopenaccess cc-by-sa trad-fre.png 1,024 × 768;310キロバイト
-
 Block partition.jpg 595 × 303;30キロバイト
-
 Blue Denube in my heart.jpg 6,624 × 2,416;2.67メガバイト
-
 Bluefin Labs - TV Genome Visualization - 2.png 1,920 × 1,080;1.41メガバイト
-
 Bluefin Labs - TV Genome Visualization.png 1,920 × 1,080;2.06メガバイト
-
 Bubble Map.png 693 × 434;203キロバイト
-
 Cantilever beam Sxx.png 1,920 × 1,671;104キロバイト
-
 China Painting Way to see Baroque Samson Agonistes Square (Czech).jpg 4,608 × 3,456;3.64メガバイト
-
 Ck8gRgSWUAAKGIA.jpg 1,200 × 1,200;210キロバイト
-
 Climate data analysis using tSNE method.png 814 × 805;94キロバイト
-
 Comparison of simple power law curves in original and log-log scale.png 1,200 × 1,560;110キロバイト
-
 Complex Fibonacci Spiral with Complex Binet Variation.gif 768 × 768;1.01メガバイト
-
 Complex Fibonacci Spiral with Positive and Negative Binet Variations.gif 768 × 768;6.57メガバイト
-
 Complex Fibonacci Spiral.gif 768 × 768;5.56メガバイト
-
 Conformal Map1.jpg 1,080 × 810;732キロバイト
-
 Conformal Map2.jpg 1,080 × 810;734キロバイト
-
 Curiosit visualization multivariate data.png 470 × 289;175キロバイト
-
 Data visualization.png 1,043 × 446;88キロバイト
-
 Demonstrative visualization of personal attacks on Wikipedia.jpg 1,024 × 768;176キロバイト
-
 Demonstrative visualization of personal attacks on Wikipedia.png 1,888 × 1,000;1,018キロバイト
-
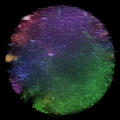
 Dental pulp stem cells. SEM-BSE.jpg 1,536 × 1,152;1.08メガバイト
-
 Digitacion Dulzaina Castellana con llaves.png 1,219 × 666;92キロバイト
-
 Digital elevation model (DEM) of South Crimea.png 1,745 × 923;1.66メガバイト
-
 Directional intra prediction Endeavour.png 216 × 180;3キロバイト
-
 DMA Choropleth Map.jpg 608 × 453;78キロバイト
-
 Doorway of Esztergom Cathedral (Hungary).jpg 3,456 × 4,608;4.64メガバイト
-
 Elephantsdream vectorstill04 crop.png 1,130 × 1,080;690キロバイト
-
 Elephantsdream vectorstill06.png 1,920 × 1,080;1.87メガバイト
-
 Elephantsdream vectorstill07.png 1,920 × 1,080;2.53メガバイト
-
 Elephantsdream vectorstill08.png 1,920 × 1,080;2.32メガバイト
-
 Elephantsdream vectorstill09.png 1,920 × 1,080;2.15メガバイト
-
 Elephantsdream vectorstill10.png 1,920 × 1,080;1.93メガバイト
-
 England Temperature since 1659.jpg 1,200 × 600;115キロバイト
-
 English Wikipedia clickstream communities December 2018.png 6,025 × 5,297;33.63メガバイト
-
 Entwurf Ansicht LandesbibOOE.jpg 3,000 × 2,291;1.22メガバイト
-
 Example of Thompson sampling.webp 640 × 480;2.6メガバイト
-
 Family Board.JPG 5,184 × 3,888;7.13メガバイト
-
 Fishing scene in 2017 when sea opened.jpg 3,264 × 1,836;1.9メガバイト
-
 FMD3Dwizualizacjalazienka.jpg 1,920 × 1,080;292キロバイト
-
 Force Directed Graph.png 658 × 592;222キロバイト
-
 GDP per capita of Botswana, 1950 to 2016.png 3,400 × 2,400;454キロバイト
-
 Gnuplot heatmap 3.svg 512 × 341;140キロバイト
-
 GOLDSCHMIDT-14F-OA-EARTHSCI.jpg 6,303 × 4,748;3.03メガバイト
-
 Grafico.svg 731 × 551;27キロバイト
-
 Halbach Array.jpg 5,000 × 2,813;1.72メガバイト
-
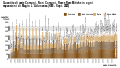
 Hours of sick leave of attraction operators by sex (2015-2018).png 1,895 × 977;398キロバイト
-
 HumanKnowledgeRelationships.svg 744 × 1,052;21キロバイト
-
 Image graphmetier.png 1,901 × 971;386キロバイト
-
 Image-graph hr par age.png 1,887 × 962;440キロバイト
-
 Informing biodiversity maps.png 966 × 608;89キロバイト
-
 Interactive Visualization Exhibit.jpg 1,067 × 664;275キロバイト
-
 Inventory Locations Represented as a Map.png 1,024 × 583;280キロバイト
-
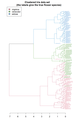 Iris dendrogram.png 910 × 1,300;74キロバイト
-
 IThena Project Full Graph 5000x5000.png 5,000 × 5,000;7.77メガバイト
-
 IThena Project SectionA Graph 1000x1000.png 1,000 × 1,000;510キロバイト
-
 IThena Project SectionB Graph 500x500.png 500 × 500;110キロバイト
-
 Jaroves-Vitejte-3-3840x2160.jpg 3,840 × 2,160;441キロバイト
-
 Keogram explainer.gif 479 × 687;3.29メガバイト
-
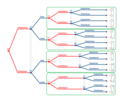
 Language Interconnection Map - Jun 2011-binarytree.svg 595 × 621;221キロバイト
-
 Lichtgrenze Brandenburg Gate visualization.jpg 1,666 × 1,063;1.99メガバイト
-
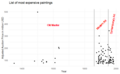 List of most expensive paintings.png 700 × 432;8キロバイト
-
 LOF.svg 655 × 585;142キロバイト
-
 Lone tree (Willow) in 2019 Spring Night.jpg 3,456 × 4,608;3.75メガバイト
-
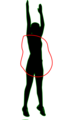 Main part of human body.png 400 × 693;32キロバイト
-
 Mairie-Versailles-France-John-Events-Photographe-HDR.jpg 4,285 × 2,847;2.11メガバイト
-
 Marching squares algorithm.svg 757 × 509;51キロバイト
-
 Maximum Subarray Visualization.svg 400 × 300;2キロバイト
-
 Meditaciones con AL.jpg 1,600 × 720;107キロバイト
-
 Minh Hoa Tor.png 2,880 × 1,080;97キロバイト
-
 MLS Cup Playoff History.svg 656 × 685;250キロバイト
-
 Moranscatterplot01.png 667 × 668;23キロバイト
-
 Morphyre Biotunnel Scene.png 714 × 410;564キロバイト
-
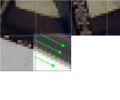
 Motion vectors Big Buck Bunny pf2.png 640 × 352;146キロバイト
-
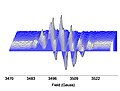 MSEPR1.jpg 1,706 × 1,288;590キロバイト
-
 Nazeer superstarz.jpg 1,280 × 1,024;151キロバイト
-
 NTP screenshot.jpg 1,888 × 864;181キロバイト
-
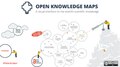 Open Knowledge Maps for the Wikiverse!.pdf 2,000 × 1,125、16 ページ;1.92メガバイト
-
 Operanteskonditionieren.png 797 × 938;109キロバイト
-
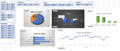
 Oracle Analytics Cloud Dashboard by Benjamin Arnulf presented by Larry Ellison.jpg 4,032 × 3,024;1.97メガバイト
-
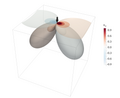
 OrionLuminositiesObs,Model.tiff 4,671 × 4,672;1.35メガバイト
-
 Out of Specification Graphic V2.pdf 1,014 × 320;18キロバイト
-
 PatternRecognition1.jpg 1,080 × 810;402キロバイト
-
 PatternRecognition2.jpg 1,080 × 810;398キロバイト
-
 Planung Online Sprechstunde kurs.jpg 864 × 690;624キロバイト
-
 Point load halfspace.png 3,800 × 3,088;622キロバイト
-
 Portail Iran - Visualisation Gephi FA2.png 8,000 × 8,000;96.43メガバイト
-
 Postzeitung Briefediagramm 1619 v1.svg 1,300 × 540;68キロバイト
-
 Psychedelic-music-on-wikipedia2.png 1,102 × 706;608キロバイト
-
 Public + Private Space.jpg 1,454 × 1,444;406キロバイト
-
 Quadratic Equation Solution Visualized by a Mapping Diagram.png 1,125 × 1,509;60キロバイト
-
 Quantità dei diversi tipi di rarità nelle espansioni.svg 512 × 288;47キロバイト
-
 Rainbow boxes displaying the properties of amino acids.png 1,514 × 312;33キロバイト
-
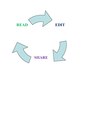 Read Edit Share.pdf 1,239 × 1,752;248キロバイト
-
 Read Edit Share.svg 480 × 480;11キロバイト
-
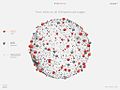
 Relationship graph of Panama Papers.png 4,096 × 4,096;17.27メガバイト
-
 Render sala.jpg 1,280 × 960;247キロバイト
-
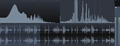 Resonic Pro Visualizations.png 1,656 × 630;113キロバイト
-
 Riigiametnike maailma visualiseering.png 1,643 × 1,525;217キロバイト
-
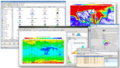 Screenshot of Metview desktop.png 2,220 × 1,260;1.66メガバイト
-
 Seqserv-circos.png 908 × 958;136キロバイト
-
 Seqserv-length-dist.png 4,235 × 750;111キロバイト
-
 Sintel Motion Vectors.png 1,428 × 818;1.75メガバイト
-
 Six degrees of separation.svg 800 × 600;189キロバイト
-
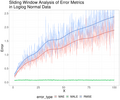 Sliding Window Error Metrics Loglog Normal Data.png 1,440 × 1,200;309キロバイト
-
 SP 25 black text.png 4,644 × 2,402;647キロバイト
-
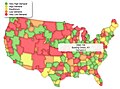
 State Choropleth.png 1,004 × 629;138キロバイト
-
 Steps read edit share Wikipedia.svg 744 × 1,052;490キロバイト
-
 Storyline Visualization.jpg 6,548 × 3,212;2.44メガバイト
-
 Sun-rising on autumn morning.jpg 3,456 × 4,608;3メガバイト
-
 Supernova Visualization.jpg 1,024 × 1,024;531キロバイト
-
 Temocouple.png 501 × 189;4キロバイト
-
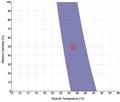 Temperature-relative humidity chart - PMV method.pdf 622 × 527;105キロバイト
-
 Thermofit1.jpg 1,775 × 1,013;277キロバイト
-
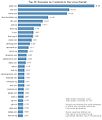 Top 30 Domains by Commits to the Linux Kernel.jpg 500 × 586;39キロバイト
-
 Tri-parametric-bar-chart.png 1,049 × 60;2キロバイト
-
 Tri-parametric-bar-chart.svg 512 × 512;30キロバイト
-
 Triangle stripe2.svg 1,403 × 446;20キロバイト
-
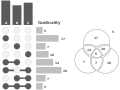
 UpSet Intersection Concept.svg 512 × 418;17キロバイト
-
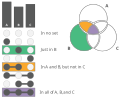
 UpSet Plot and a Corresponding Venn Diagram.svg 512 × 385;15キロバイト
-
 Variogramcloud01.png 671 × 670;40キロバイト
-
 Vidyo1 AV1 2018-03 Q63 frame 24+bits+MV+split.png 512 × 512;162キロバイト
-
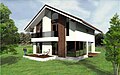 Vila Tip C1 - Hystria Residence.jpg 990 × 618;112キロバイト
-
 Virginia 2021 GOP Attorney General Election RCV Results.gif 1,280 × 720;649キロバイト
-
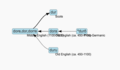 Visjs directed graph error.png 507 × 296;27キロバイト
-
 VisLab of the UFZ in Leipzig.jpg 2,835 × 1,163;1.1メガバイト
-

-
 Visualizing Loglog Normal Data.png 2,400 × 1,200;439キロバイト
-
 VP9 bit usage ToS f00808.png 1,115 × 754;23キロバイト
-
 VP9 macroblocks ToS f00808.png 1,115 × 754;923キロバイト
-
 VP9 motion vectors ToS f01211.png 1,054 × 754;1.14メガバイト
-
 Wattenberg chess visualization 050421.jpg 2,272 × 1,704;461キロバイト
-
 WGD1b.png 1,099 × 915;73キロバイト
-
 Wikidata Starland map.png 1,403 × 556;555キロバイト
-
 Wikidata-china-japan-jul2013.png 1,405 × 647;261キロバイト

.jpg)


.jpg)
.jpg)


.jpg)


_of_South_Crimea.png)


.jpg)


.png)


_in_2019_Spring_Night.jpg)


