File:הסיכון היחסי לתמותה במחקר HUNT כתלות במאפייני לחץ דם.png
Jump to navigation
Jump to search
Size of this preview: 584 × 600 pixels. Other resolutions: 234 × 240 pixels | 467 × 480 pixels | 748 × 768 pixels | 997 × 1,024 pixels | 1,800 × 1,849 pixels.
Original file (1,800 × 1,849 pixels, file size: 40 KB, MIME type: image/png)
Captions
Captions
A graph representing mortality risk ratio results of Hypertention in the HUNT cohort study as published on 2017
Summary
[edit]
| Description |
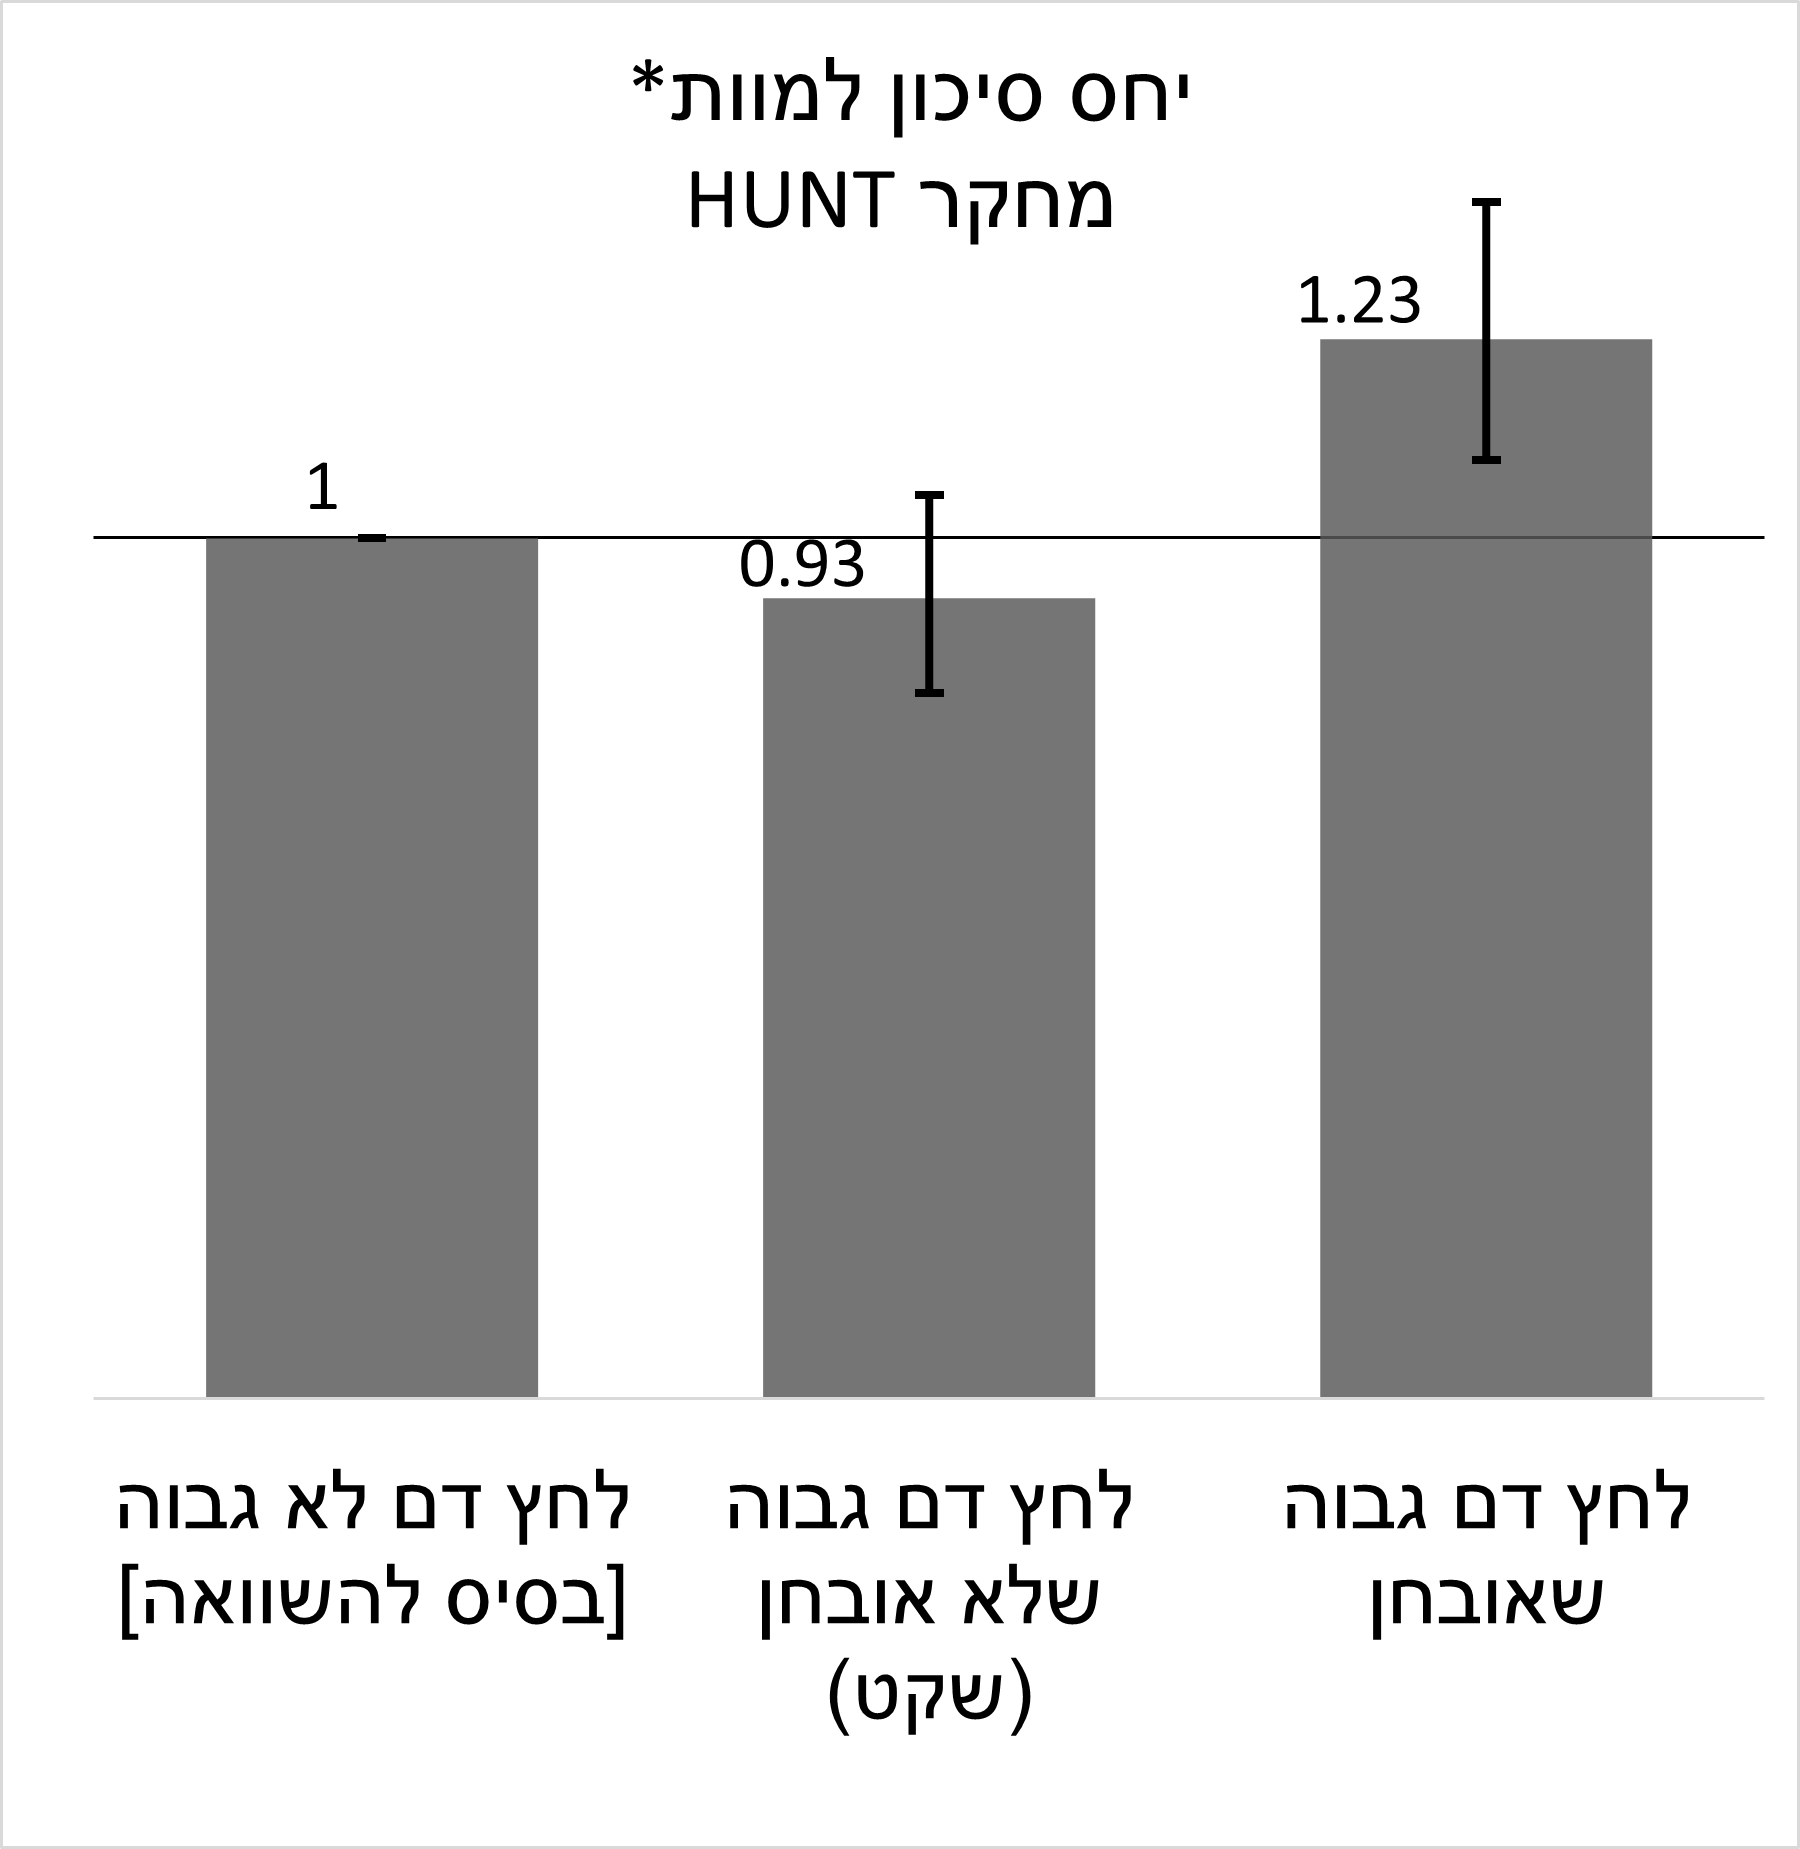
עברית: ב-7.12.2017 פורסמו תוצאות ממחקר HUNT, שכלל את תושבי מחוז צפון טרנדלג בנורבגיה. המחקר החל ב-1995-1997 וכלל 63371 בני 20 ומעלה עם דיווח עצמי על לחץ דם גבוה שלהם בתחילתו או מדידה שלו. המחקר הסתיים ב-2016. הגרף מתאר את תוצאות ניתוח הסיכון היחסי לתמותה מכלל הסיבות בהשוואה בין 3 קבוצות: קבוצת לחץ דם תקין (כבסיס לחישוב), קבוצת לחץ דם גבוה ללא איבחון (יתר לחץ דם שקט) וקבוצת לחץ דם גבוה מאובחנת. * הסיכון היחסי למוות מתוקנן לפי גיל, מין, משקל גוף יחסי, סטטוס עישון, רמת השכלה, מחלה ממושכת מגבילה, פעילות גופנית, רמות כולסטרול וקריאטינין בדם.
ה'אנטנות' בתרשים מייצגות את טווח הביטחון הסטטיסטי של 95%. הגרף מבוסס על התוצאות שדווחו במאמר [1] בטבלה 3 (מודל 2) [2] ונוצר באמצעות תוכנת EXCEL. |
| Date |
|
| Source |
Own work |
| Author |
Tsabarn |
| Description |
English: On December 7th 2017, results from the HUNT Study that included the Nord-Trøndelag county, were reported. This research began in 1997-1995 and included 63,371 people aged 20 and over with self-reported high blood pressure at baseline or blood pressure measurement. The research was completed in 2016. The graph depicts the results of the analysis of the relative risk of mortality from all causes, comparing 3 groups: a normal blood pressure group (as a basis for the calculation), an undiagnosed high blood pressure group (silent hypertension) and a diagnosed high blood pressure group. * The relative risk of death is standardized by age, sex, relative body weight, smoking status, level of education, long-term limiting disease, physical activity, blood cholesterol and creatinine levels.
The 'antennas' in the chart represent the statistical 95% confidence interval. The graph is based on the results reported in the article [3] in Table 3 (model 2) [4] and was created using EXCEL software. |
| Date |
|
| Source |
Own work |
| Author |
Tsabarn |
Licensing
[edit]
I, the copyright holder of this work, hereby publish it under the following license:
| This file is made available under the Creative Commons CC0 1.0 Universal Public Domain Dedication. | |
| The person who associated a work with this deed has dedicated the work to the public domain by waiving all of their rights to the work worldwide under copyright law, including all related and neighboring rights, to the extent allowed by law. You can copy, modify, distribute and perform the work, even for commercial purposes, all without asking permission.
|
File history
Click on a date/time to view the file as it appeared at that time.
| Date/Time | Thumbnail | Dimensions | User | Comment | |
|---|---|---|---|---|---|
| current | 21:55, 2 February 2024 | | 1,800 × 1,849 (40 KB) | Tsabarn (talk | contribs) | Uploaded own work with UploadWizard |
You cannot overwrite this file.
File usage on Commons
There are no pages that use this file.
File usage on other wikis
The following other wikis use this file:
- Usage on he.wikipedia.org