File:07 July - Percent of global area at temperature records - Global warming - NOAA.svg
ナビゲーションに移動
検索に移動

この SVG ファイルのこの PNG プレビューのサイズ: 800 × 560 ピクセル. その他の解像度: 320 × 224 ピクセル | 640 × 448 ピクセル | 1,024 × 717 ピクセル | 1,280 × 896 ピクセル | 2,560 × 1,792 ピクセル | 1,000 × 700 ピクセル。
元のファイル (SVG ファイル、1,000 × 700 ピクセル、ファイルサイズ: 5キロバイト)
キャプション
キャプション
このファイルの内容を1行で記述してください
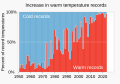
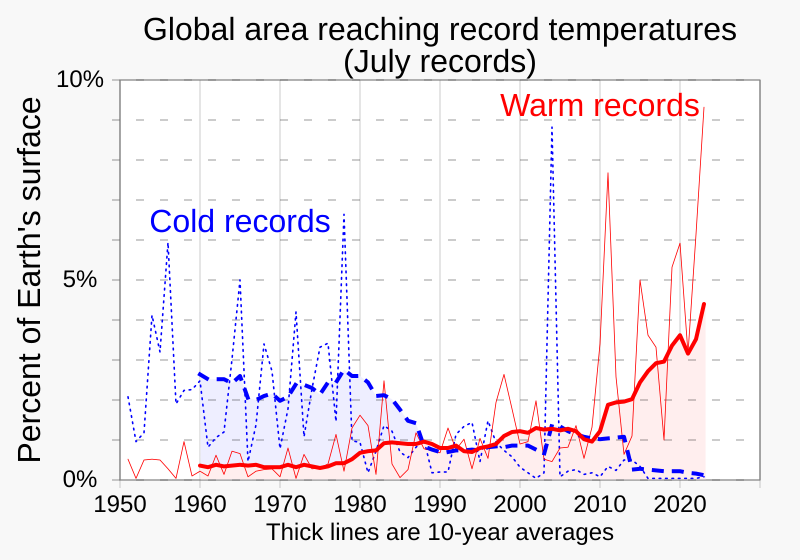
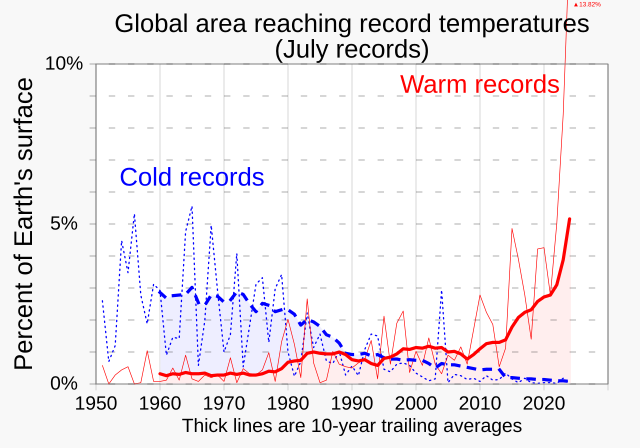
Line graphs of the percentages of Earth's surface reaching a record July temperature as a function of time over years 1951-, from NOAA data
概要
[編集]| 解説 |
English: Line graphs of the percentages of Earth's surface reaching a record July temperature as a function of time over years 1951-, from NOAA data.
|
||
| 日付 | |||
| 原典 | 投稿者自身による著作物 | ||
| 作者 | RCraig09 |

Related files
[編集]-
 01 January - Percent of global area at temperature records - Global warming - NOAA.svg
(January data) -
 02 February - Percent of global area at temperature records - Global warming - NOAA.svg
(February data) -
 03 March - Percent of global area at temperature records - Global warming - NOAA.svg
(March data) -
 04 April - Percent of global area at temperature records - Global warming - NOAA.svg
(April data) -
 05 May - Percent of global area at temperature records - Global warming - NOAA.svg
(May data) -
 06 June - Percent of global area at temperature records - Global warming - NOAA.svg
(June data)


-
 07 July - Percent of global area at temperature records - Global warming - NOAA.svg
(July data) -
 08 August - Percent of global area at temperature records - Global warming - NOAA.svg
(August data) -
 09 September - Percent of global area at temperature records - Global warming - NOAA.svg
(September data) -
 10 October - Percent of global area at temperature records - Global warming - NOAA.svg
(October data) -
 11 November - Percent of global area at temperature records - Global warming - NOAA.svg
(November data) -
 12 December - Percent of global area at temperature records - Global warming - NOAA.svg
(December data)


-
 1951+ Percent of global area at temperature records - Seasonal comparison - NOAA.svg
Seasonal comparison -
 1951 - Percent of global area at temperature records (monthly) - Global warming - NOAA.svg
All months scatterplot/dot plot -
 1951- RATIO of new record warm temperatures to new record cold temperatures (monthly) - Global warming.svg
Ratios scatterplot/dot plot (monthly) -
 1951- Percent of record temperatures that are cold or warm records.svg
 -
 1951- Warm and cold record temperatures - bar chart.svg

_-_Global_warming_-_NOAA.svg)
_-_Global_warming.svg)


ライセンス
[編集]
この作品の著作権者である私は、この作品を以下のライセンスで提供します。
このファイルはクリエイティブ・コモンズ 表示-継承 4.0 国際ライセンスのもとに利用を許諾されています。
- あなたは以下の条件に従う場合に限り、自由に
- 共有 – 本作品を複製、頒布、展示、実演できます。
- 再構成 – 二次的著作物を作成できます。
- あなたの従うべき条件は以下の通りです。
- 表示 – あなたは適切なクレジットを表示し、ライセンスへのリンクを提供し、変更があったらその旨を示さなければなりません。これらは合理的であればどのような方法で行っても構いませんが、許諾者があなたやあなたの利用行為を支持していると示唆するような方法は除きます。
- 継承 – もしあなたがこの作品をリミックスしたり、改変したり、加工した場合には、あなたはあなたの貢献部分を元の作品とこれと同一または互換性があるライセンスの下に頒布しなければなりません。
ファイルの履歴
過去の版のファイルを表示するには、その版の日時をクリックしてください。
| 日付と時刻 | サムネイル | 寸法 | 利用者 | コメント | |
|---|---|---|---|---|---|
| 現在の版 | 2023年8月15日 (火) 03:42 | | 1,000 × 700(5キロバイト) | RCraig09(トーク | 投稿記録) | Version 20: update to include data through July 2023 |
| 2023年7月29日 (土) 03:54 |  | 1,000 × 700(7キロバイト) | RCraig09(トーク | 投稿記録) | Version 9: centering some text strings . . . making "(July records)" more conspicuous | |
| 2023年7月28日 (金) 15:18 |  | 1,000 × 700(7キロバイト) | RCraig09(トーク | 投稿記録) | Version 8: created new graphic for JULY figures.... but only through July 2021 . . . I plan to update when July 2023 data becomes available | |
| 2023年6月15日 (木) 16:47 |  | 1,000 × 700(9キロバイト) | RCraig09(トーク | 投稿記録) | Version 7: arrange order of code to make horizontal gridlines appear in front of colored areas | |
| 2023年5月25日 (木) 22:09 |  | 1,000 × 700(9キロバイト) | RCraig09(トーク | 投稿記録) | Version 6: Add blue fill area . . . . simplify horizontal axis | |
| 2023年5月25日 (木) 15:50 |  | 1,000 × 750(9キロバイト) | RCraig09(トーク | 投稿記録) | Version 5: changed dark blue line to dashed line . . . . making read fill-area be under 10-year average (rather than under annual numbers which are not as smooth a trace) | |
| 2023年5月25日 (木) 05:15 |  | 1,000 × 750(9キロバイト) | RCraig09(トーク | 投稿記録) | Version 4: Add 10-year moving averages traces | |
| 2023年5月24日 (水) 18:50 |  | 1,000 × 750(6キロバイト) | RCraig09(トーク | 投稿記録) | Version 3: update to include data through April 2023 . . . . add shading under red trace | |
| 2021年9月2日 (木) 19:31 |  | 1,000 × 750(5キロバイト) | RCraig09(トーク | 投稿記録) | Version 2: Amending title to be more descriptive | |
| 2021年9月2日 (木) 19:06 |  | 1,000 × 750(5キロバイト) | RCraig09(トーク | 投稿記録) | Uploaded own work with UploadWizard |
このファイルは上書きできません。
ファイルの使用状況
以下の 26 ページがこのファイルを使用しています:
- User:RCraig09
- User:RCraig09/Charts of record temperatures
- File:01 January - Percent of global area at temperature records - Global warming - NOAA.svg
- File:02 February - Percent of global area at temperature records - Global warming - NOAA.svg
- File:03 March - Percent of global area at temperature records - Global warming - NOAA.svg
- File:04 April - Percent of global area at temperature records - Global warming - NOAA.svg
- File:05 May - Percent of global area at temperature records - Global warming - NOAA.svg
- File:06 June - Percent of global area at temperature records - Global warming - NOAA.svg
- File:07 July - Percent of global area at temperature records - Global warming - NOAA.svg
- File:08 August - Percent of global area at temperature records - Global warming - NOAA.svg
- File:09 September - Percent of global area at temperature records - Global warming - NOAA.svg
- File:09 September - Percent of global area at temperature records - Global warming - NOAA cs.svg
- File:10 October - Percent of global area at temperature records - Global warming - NOAA.svg
- File:11 November - Percent of global area at temperature records - Global warming - NOAA.svg
- File:12 December - Percent of global area at temperature records - Global warming - NOAA.svg
- File:1940- August global average temperature changes.svg
- File:1940- July global average temperature changes.svg
- File:1940- June global average temperature changes.svg
- File:1940- October global average temperature changes.svg
- File:1940- September global average temperature changes.svg
- File:1951+ Percent of global area at temperature records - Seasonal comparison - NOAA.svg
- File:1951- Percent of record temperatures that are cold or warm records.svg
- File:1951- RATIO of new record warm temperatures to new record cold temperatures (monthly) - Global warming.svg
- File:1951- Warm and cold record temperatures - bar chart.svg
- File:1951 - Percent of global area at temperature records (monthly) - Global warming - NOAA.svg
- File:202107 Percent of global area at temperature records - Global warming - NOAA.svg (リダイレクト)
グローバルなファイル使用状況
以下に挙げる他のウィキがこの画像を使っています:
- bn.wikipedia.org での使用状況
- en.wikipedia.org での使用状況
- es.wikipedia.org での使用状況
- fa.wikipedia.org での使用状況
- ja.wikipedia.org での使用状況
- no.wikipedia.org での使用状況
- ta.wikipedia.org での使用状況
- tr.wikipedia.org での使用状況