File:2005ICT.PNG
跳转到导航
跳转到搜索

本预览的尺寸:800 × 351像素。 其他分辨率:320 × 140像素 | 640 × 281像素 | 1,425 × 625像素。
原始文件 (1,425 × 625像素,文件大小:59 KB,MIME类型:image/png)
说明
说明
添加一行文字以描述该文件所表现的内容
| 描述 |
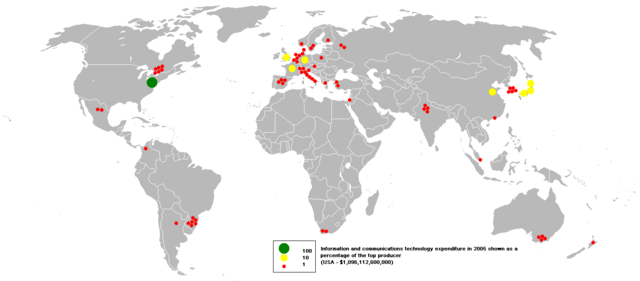
This bubble map shows the global distribution of spending on information and communication technologies in 2005 as a percentage of the top market (USA - $1,096,112,600,000). This map is consistent with incomplete set of data too as long as the top market is known. It resolves the accessibility issues faced by colour-coded maps that may not be properly rendered in old computer screens. Data was extracted on 4th July 2007 from http://siteresources.worldbank.org/DATASTATISTICS/Resources/table5_11.pdf Based on Image:BlankMap-World.png |
||
| 来源 | Originally uploaded at en wiki by User:Anwar saadat under PD-self licence | ||
| 作者 | en:User:Anwar saadat | ||
| 授权 (二次使用本文件) |
|

|
此economic map图片可使用矢量图形重新创建为SVG文件。这具有很多好处;更多信息请参见共享资源:待清理媒体。如果存在此图片的SVG格式,请将其上传,然后将此模板替换为
{{vector version available|新图片名称}}。
建议您将SVG命名为“2005ICT.svg”,这样在使用Vector version available(或Vva)模板时就不需要填写新图片名称参数。 |
文件历史
点击某个日期/时间查看对应时刻的文件。
| 日期/时间 | 缩略图 | 大小 | 用户 | 备注 | |
|---|---|---|---|---|---|
| 当前 | 2007年10月27日 (六) 01:58 | | 1,425 × 625(59 KB) | Shushruth(留言 | 贡献) | {{Description=This bubble map shows the global distribution of spending on information and communication technologies in 2005 as a percentage of the top market (USA - $1,096,112,600,000). This map is consistent with incomplete set of data too as long as |
您不可以覆盖此文件。
文件用途
没有页面使用本文件。
全域文件用途
以下其他wiki使用此文件:
- an.wikipedia.org上的用途
- ar.wikipedia.org上的用途
- as.wikipedia.org上的用途
- ba.wikipedia.org上的用途
- be-tarask.wikipedia.org上的用途
- ca.wikipedia.org上的用途
- es.wikipedia.org上的用途
- gl.wikipedia.org上的用途
- hi.wikipedia.org上的用途
- id.wikipedia.org上的用途
- jv.wikipedia.org上的用途
- ka.wikipedia.org上的用途
- kk.wikipedia.org上的用途
- kn.wikipedia.org上的用途
- la.wikipedia.org上的用途
- mhr.wikipedia.org上的用途
- min.wikipedia.org上的用途
- mk.wikipedia.org上的用途
- mwl.wikipedia.org上的用途
- my.wikipedia.org上的用途
- ro.wikipedia.org上的用途
- ru.wikipedia.org上的用途
- si.wikipedia.org上的用途
- sk.wikipedia.org上的用途
- so.wikipedia.org上的用途
- sw.wikipedia.org上的用途
- tn.wikipedia.org上的用途
- vi.wikipedia.org上的用途
- zh.wikipedia.org上的用途