File:2005cassava.PNG

Archivo original (1425 × 625 píxeles; tamaño de archivo: 60 kB; tipo MIME: image/png)
Leyendas
Leyendas
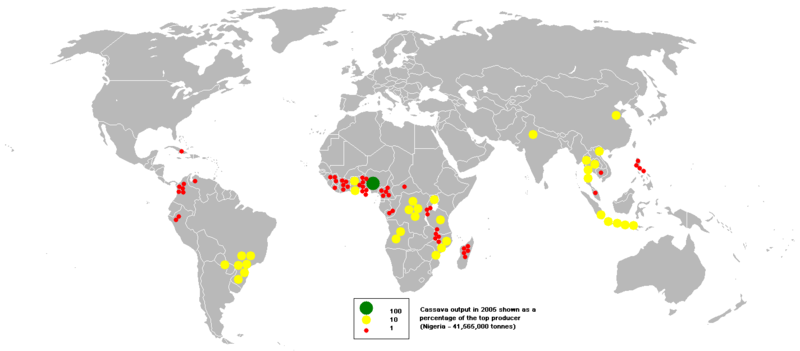
This bubble map shows the global distribution of cassava (Manihot esculenta) output in 2005 as a percentage of the top producer (Nigeria - 41,565,000 tonnes).
This map is consistent with incomplete set of data too as long as the top producer is known. It resolves the accessibility issues faced by colour-coded maps that may not be properly rendered in old computer screens.
Data was extracted on 9th June 2007 from http://faostat.fao.org/site/336/DesktopDefault.aspx?PageID=336
Based on Image:BlankMap-World.png
| Descripción | Cassava output in 2005 | ||
| Fuente | Originally from en.wikipedia; description page is/was here. Original uploader was Anwar saadat at en.wikipedia | ||
| Autor | Anwar saadat at en.wikipedia | ||
| Permiso (Reutilización de este archivo) |
|
||
| Otras versiones | Obras derivadas de ésta: 2005cassava-2.PNG |
Historial del archivo
Haz clic sobre una fecha y hora para ver el archivo tal como apareció en ese momento.
| Fecha y hora | Miniatura | Dimensiones | Usuario | Comentario | |
|---|---|---|---|---|---|
| actual | 23:05 11 dic 2007 | | 1425 × 625 (60 kB) | Gridge (discusión | contribs.) | This bubble map shows the global distribution of cassava output in 2005 as a percentage of the top producer (Nigeria - 41,565,000 tonnes). This map is consistent with incomplete set of data too as long as the top producer is known. It resolves the access |
No puedes sobrescribir este archivo.
Usos del archivo
Las siguientes páginas usan este archivo:
Uso global del archivo
Las wikis siguientes utilizan este archivo:
- Uso en el.wikipedia.org
- Uso en eo.wikipedia.org
- Uso en es.wikipedia.org
- Uso en ha.wikipedia.org
- Uso en he.wikipedia.org
- Uso en it.wikipedia.org
- Uso en pl.wikipedia.org
- Uso en pt.wikibooks.org