File:20201019 Levelized Cost of Energy (LCOE, Lazard) - renewable energy.svg
跳转到导航
跳转到搜索

此SVG文件的PNG预览的大小:800 × 450像素。 其他分辨率:320 × 180像素 | 640 × 360像素 | 1,024 × 576像素 | 1,280 × 720像素 | 2,560 × 1,440像素 | 1,200 × 675像素。
原始文件 (SVG文件,尺寸为1,200 × 675像素,文件大小:4 KB)
说明
说明
添加一行文字以描述该文件所表现的内容
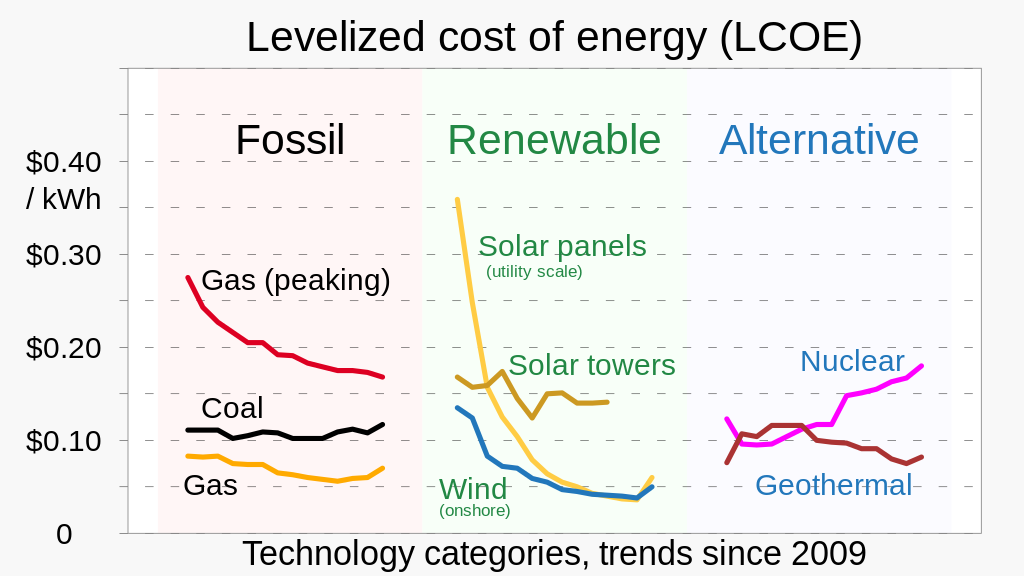
Graph of levelized cost of energy (starting with LCOE 14.0, October 2020) for various energy sources as a function of year, derived from LCOE data from Lazard
摘要
[编辑]| 描述 |
English: Graph of levelized cost of energy (starting with LCOE 14.0, October 2020) for various energy sources as a function of year, derived from LCOE data from Lazard
|
||
| 日期 | (date of Lazard LCOE report) | ||
| 来源 | 自己的作品 | ||
| 作者 | RCraig09 |
_-_renewable_energy.svg)
_-_renewable_energy.svg&action=edit§ion=1)
_-_renewable_energy.svg)
许可协议
[编辑]_-_renewable_energy.svg&action=edit§ion=2)
我,本作品著作权人,特此采用以下许可协议发表本作品:
本文件采用知识共享署名-相同方式共享 4.0 国际许可协议授权。
- 您可以自由地:
- 共享 – 复制、发行并传播本作品
- 修改 – 改编作品
- 惟须遵守下列条件:
- 署名 – 您必须对作品进行署名,提供授权条款的链接,并说明是否对原始内容进行了更改。您可以用任何合理的方式来署名,但不得以任何方式表明许可人认可您或您的使用。
- 相同方式共享 – 如果您再混合、转换或者基于本作品进行创作,您必须以与原先许可协议相同或相兼容的许可协议分发您贡献的作品。
文件历史
点击某个日期/时间查看对应时刻的文件。
| 日期/时间 | 缩略图 | 大小 | 用户 | 备注 | |
|---|---|---|---|---|---|
| 当前 | 2023年9月3日 (日) 05:18 | | 1,200 × 675(4 KB) | RCraig09(留言 | 贡献) | Version 6: change vertical scale so graphic fills plot area more completely . . . minor text changes |
| 2023年9月2日 (六) 16:36 |  | 1,200 × 675(4 KB) | RCraig09(留言 | 贡献) | Version 5: change color behind "fossil" to distinguish from framing . . . change abbreviation to "kWh" | |
| 2023年9月1日 (五) 21:06 |  | 1,200 × 675(4 KB) | RCraig09(留言 | 贡献) | Version 4: update to include more recent data; change form of chart to arrange by technology category (less klugey). | |
| 2021年6月5日 (六) 23:00 |  | 1,150 × 600(17 KB) | RCraig09(留言 | 贡献) | Version 3: reduced file size by manually removing "stuff" that Inkscape inserted | |
| 2021年2月22日 (一) 18:55 |  | 1,150 × 600(40 KB) | RCraig09(留言 | 贡献) | Version 2: changed background shading so graph area is white and border is opaque light-gray | |
| 2021年1月30日 (六) 21:46 |  | 1,150 × 600(40 KB) | RCraig09(留言 | 贡献) | Uploaded own work with UploadWizard |
您不可以覆盖此文件。
文件用途
以下页面使用本文件:
全域文件用途
以下其他wiki使用此文件:
- ar.wikipedia.org上的用途
- bn.wikipedia.org上的用途
- bs.wikipedia.org上的用途
- de.wikipedia.org上的用途
- en.wikipedia.org上的用途
- es.wikipedia.org上的用途
- fr.wikipedia.org上的用途
- id.wikipedia.org上的用途
- nl.wikipedia.org上的用途
- pl.wikipedia.org上的用途
- ru.wikipedia.org上的用途
- zh.wikipedia.org上的用途
_-_renewable_energy.svg&oldid=802167111)