File:20211109 Frequency of extreme weather for different degrees of global warming - bar chart IPCC AR6 WG1 SPM.svg
Here nagîvasyonê
Here lêgerînê

Size of this PNG preview of this SVG file: 800 × 450 pîksel. Resolusyonên din: 320 × 180 pîksel | 640 × 360 pîksel | 1024 × 576 pîksel | 1280 × 720 pîksel | 2560 × 1440 pîksel | 1200 × 675 pîksel.
Dosyeya orjînal (Daneya SVG, mezinbûna rast: 1200 × 675 pixel; mezinbûna daneyê: 5 KB)
Captions
Captions
Add a one-line explanation of what this file represents
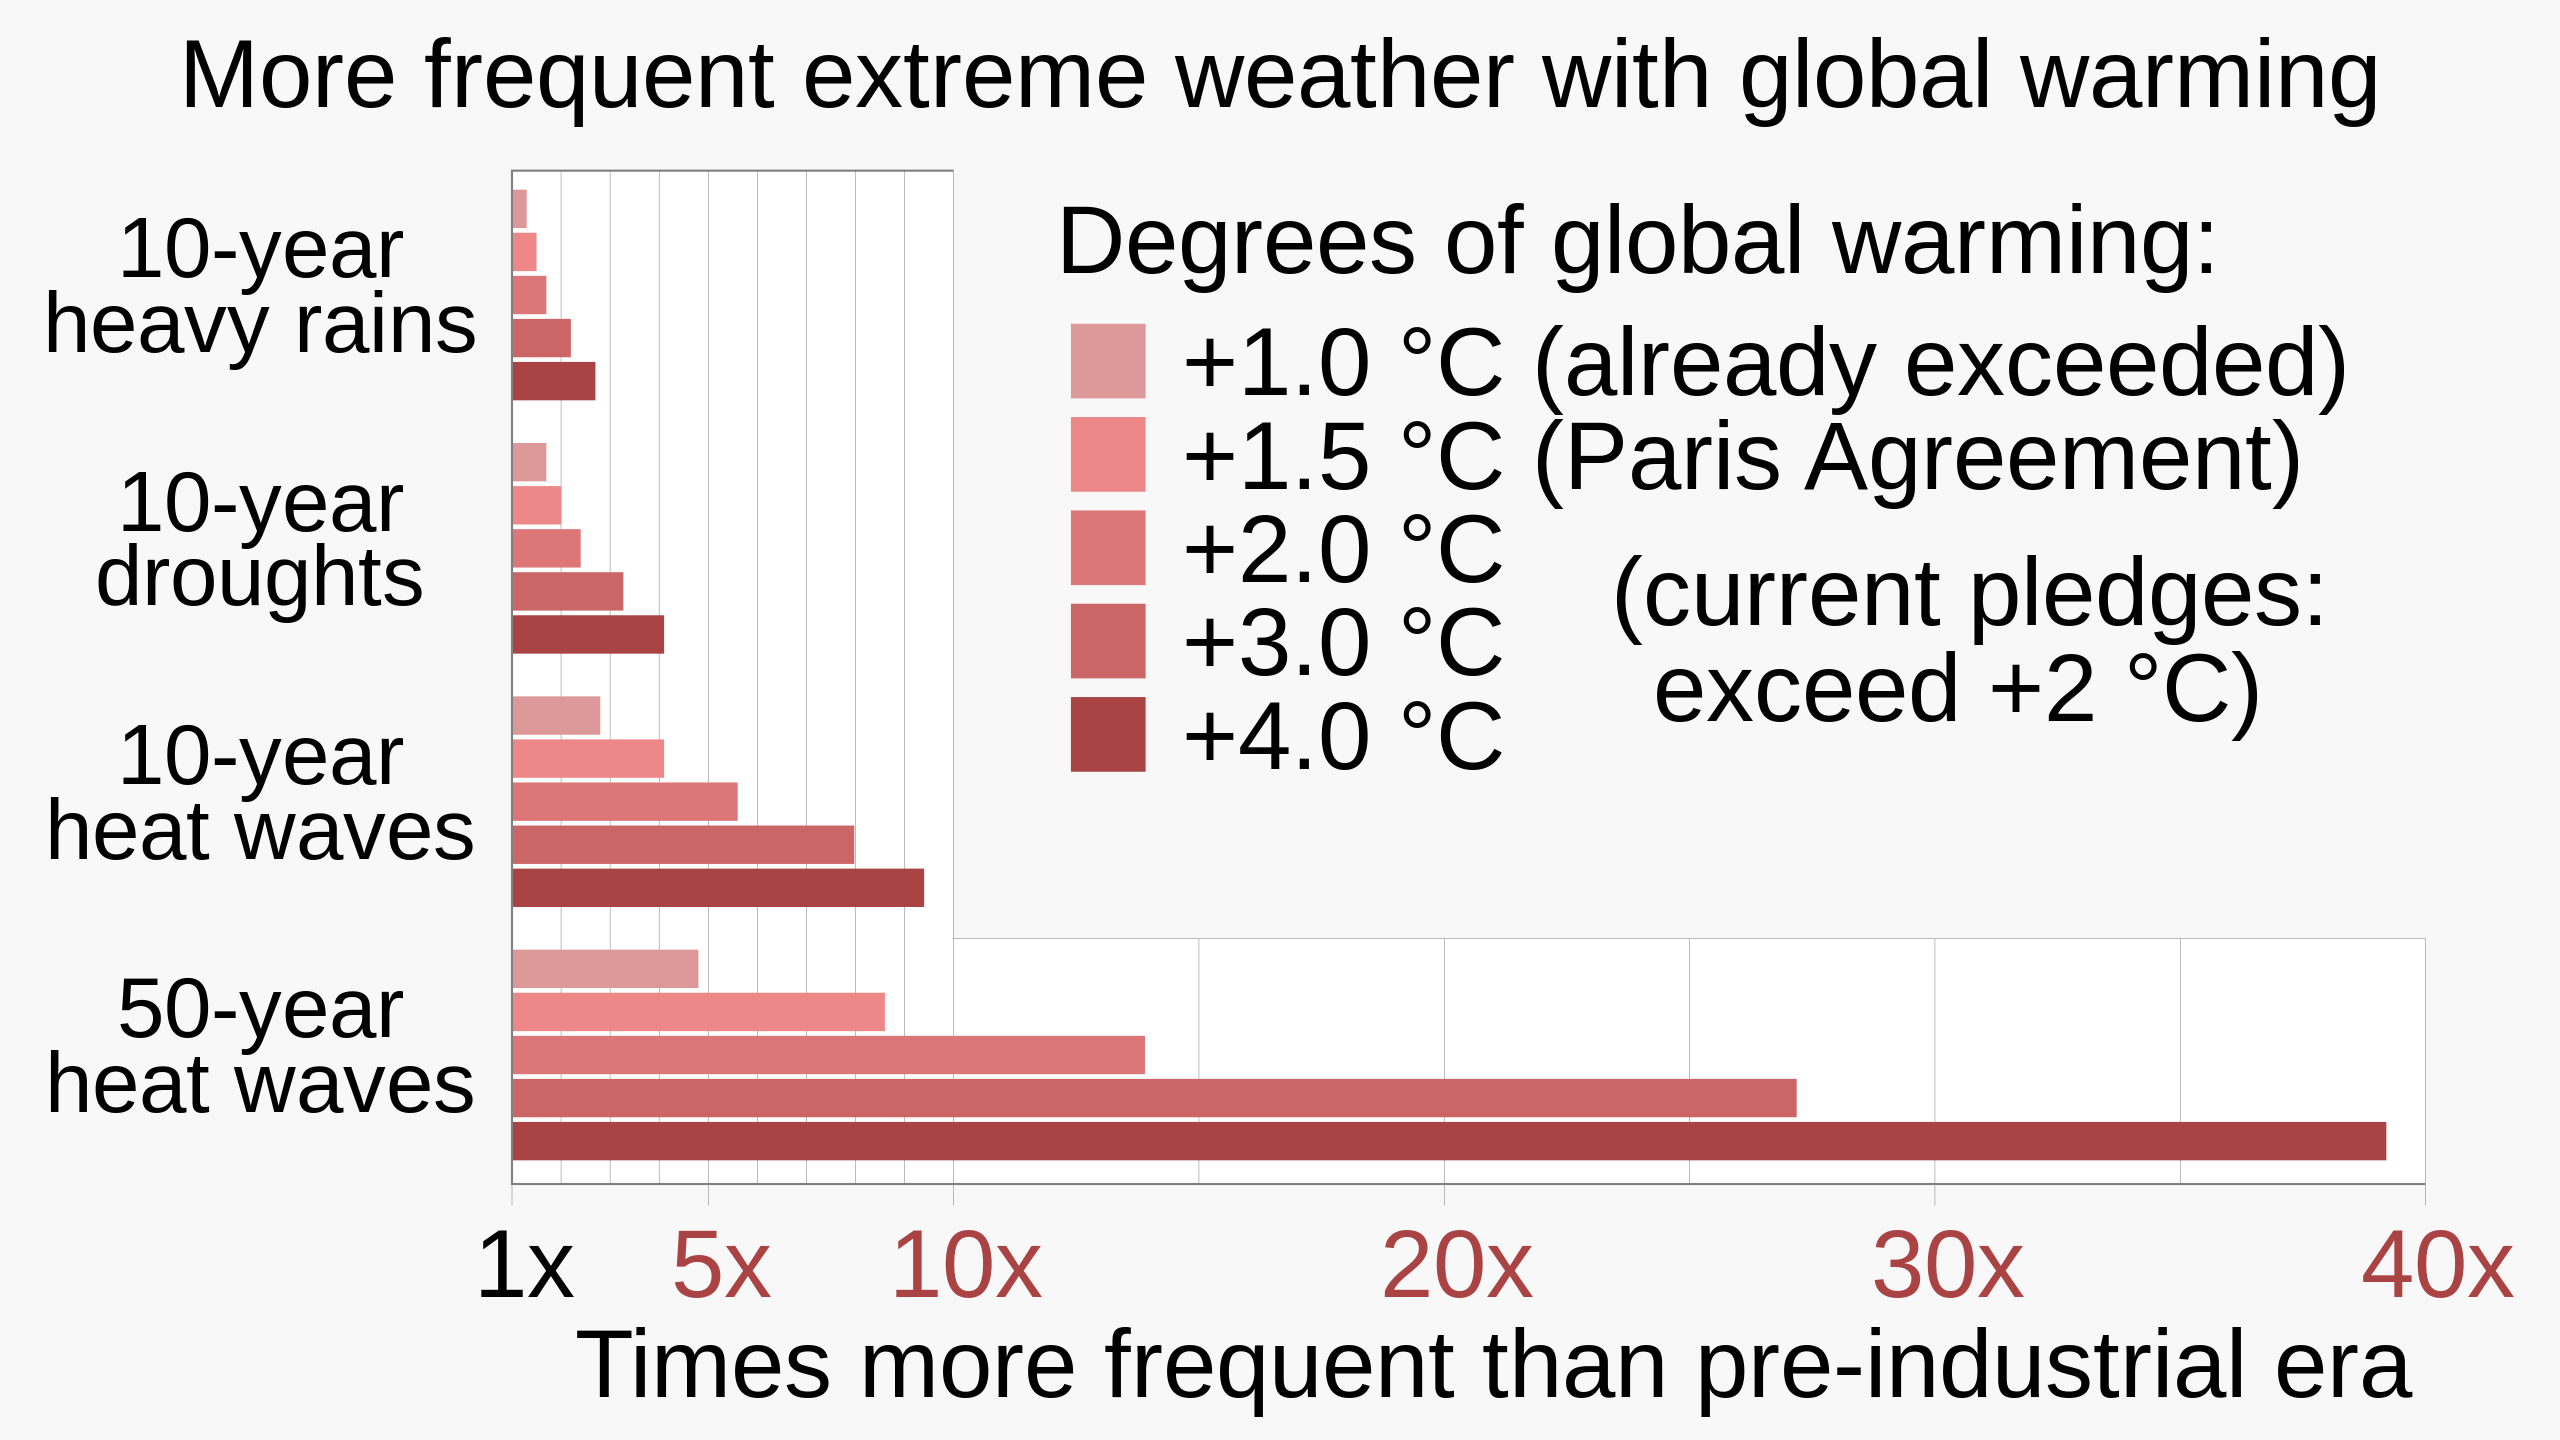
Bar chart showing frequency of extreme weather for different degrees of global warming, based on data from IPCC AR6 WG1 SPM
Danasîn[biguhêre]
| Danasîn |
English: Bar chart showing frequency of extreme weather for different degrees of global warming, based on data from IPCC AR6 WG1 SPM (Summary for Policy Makers).
|
||||
| Dîrok | |||||
| Çavkanî | Min çêkir | ||||
| Xwedî | RCraig09 | ||||
| Guhartoyên din |
|


Related files[biguhêre]
The following files are based on Fig. SPM.6 of the Sixth Assessment Report of the Intergovernmental Panel on Climate Change / Summary for Policymakers:
-
 20210809 Projected extremes for different degrees of global warming - IPCC AR6 WG1 SPM.svg
9 August 2021: Line chart of 10- and 50-year datasets (includes frequency, omits intensity) -
 20211107 Projected extremes for different degrees of global warming - 3x10yr area chart - IPCC AR6 WG1 SPM.svg
7 Nov 2021: "L" charts includes both frequency and intensity of the 10-year datasets (omits 50-year dataset) -
 20211109 Frequency of extreme weather for different degrees of global warming - bar chart IPCC AR6 WG1 SPM.svg
9 Nov 2021: Bar chart of 10- and 50-year datasets (includes frequency, omits intensity) -
 20220208 Projected temperature extremes for different degrees of global warming - orthogonal bar chart - IPCC AR6 WG1 SPM.svg
Orthogonal bar chart of 10-year heat waves (only)


Lîsans[biguhêre]
I, the copyright holder of this work, hereby publish it under the following license:
This file is licensed under the Creative Commons Attribution-Share Alike 4.0 International license.
- Tu azad î:
- parve bike – ji bo kopîkirin, belavkirin û weşandina xebatê
- ji bo guhartin û adaptekirina naverokê – ji bo adaptekirina xebatê
- Di bin van mercan de:
- isnad – Divê tu isnadeke maqûl bikî, lînekek pêşkêş bikî ji bo lîsansê, û diyar bikî ku guhartin hatiye kirin an na. Tu dikarî vê yekê bi adilî bi cih bînî, lê ne bi awayê ku wekî lîsansor te an bikaranîna te pejirandibe.
- parvekirinê mîna hev – Ger tu materyalê biguherînî, bizivirînî formeke din, an ava bikî divê beşdariyên xwe di bin eynî lîsansê an lîsansa hevaheng de wekî ya eslî belav bikî.
Dîroka daneyê
Ji bo dîtina guhartoya wê demê bişkoka dîrokê bitikîne.
| Dîrok/Katjimêr | Wêneyê biçûk | Mezinahî | Bikarhêner | Şirove | |
|---|---|---|---|---|---|
| niha | 20:44, 29 tîrmeh 2023 | | 1200 x 675 (5 KB) | RCraig09 (gotûbêj | beşdarî) | Version 12: remove <tspan> declarations embedded within <text> in the title "More frequent...", to work around ongoing text rendering problems on Wikimedia |
| 20:29, 29 tîrmeh 2023 |  | 1200 x 675 (5 KB) | RCraig09 (gotûbêj | beşdarî) | Version 11: manually changing "+1.1 °C today" to "(already exceeded)" (in the English language portion) to future-proof this graphic . . . . retained JP translation <switch> elements without change | |
| 04:57, 6 îlon 2022 |  | 1200 x 675 (5 KB) | Icosohedral (gotûbêj | beşdarî) | File uploaded using svgtranslate tool (https://svgtranslate.toolforge.org/). Added translation for zh. | |
| 17:19, 21 kanûna pêşîn 2021 |  | 1200 x 675 (3 KB) | RCraig09 (gotûbêj | beşdarî) | Version 9: misc changes per suggestions on this file's Talk page. | |
| 05:31, 22 çiriya paşîn 2021 |  | 1200 x 675 (3 KB) | RCraig09 (gotûbêj | beşdarî) | Version 8: more exact 3.0 C values . . . colors of horizontal axis tick labels | |
| 03:40, 18 çiriya paşîn 2021 |  | 1200 x 675 (3 KB) | RCraig09 (gotûbêj | beşdarî) | Version 7: adding to legend, 2.7 C under current pledges, per discussions at en.wp's Talk:Climate change | |
| 04:58, 17 çiriya paşîn 2021 |  | 1200 x 675 (4 KB) | RCraig09 (gotûbêj | beşdarî) | Version 6: Enlarge some font sizes . . . . change some text | |
| 06:07, 16 çiriya paşîn 2021 |  | 1200 x 675 (4 KB) | RCraig09 (gotûbêj | beşdarî) | Version 5: Used Liberation Sans . . . changed legend to "Present-day =+1.1 C" | |
| 18:25, 13 çiriya paşîn 2021 |  | 1200 x 675 (4 KB) | RCraig09 (gotûbêj | beşdarî) | Version 4: includes thinner, white vertical gridlines that overlay the colored bars, to make it easier to determine extent of the bars. Darker, wider gridlines remain behind the gridlines so they're visible over the white background. | |
| 04:21, 13 çiriya paşîn 2021 |  | 1200 x 675 (4 KB) | RCraig09 (gotûbêj | beşdarî) | Version 3: reduced length of some vertical grid lines; removed most of the plot-area outline. |
Tu nikarî cardin li ser vê dosyeyê binivîsînî.
Bikaranîna pelê
Ev 6 rûpel li jêr vê dosyeyê bi kar tînin:
- User:RCraig09
- File:20210809 Projected extremes for different degrees of global warming - IPCC AR6 WG1 SPM.svg
- File:20211107 Projected extremes for different degrees of global warming - 3x10yr area chart - IPCC AR6 WG1 SPM.svg
- File:20211109 Frequency of extreme weather for different degrees of global warming - bar chart IPCC AR6 WG1 SPM.svg
- File:20211109 Frequency of extreme weather for different degrees of global warming - bar chart IPCC AR6 WG1 SPM cs.svg
- File:20220208 Projected temperature extremes for different degrees of global warming - orthogonal bar chart - IPCC AR6 WG1 SPM.svg
Bikaranîna gerdûnî ya pelê
Ev wîkiyên di rêzê de vê pelê bi kar tînin:
- Bikaranîna di bn.wikipedia.org de
- Bikaranîna di de.wikipedia.org de
- Bikaranîna di en.wikipedia.org de
- Bikaranîna di eo.wikipedia.org de
- Bikaranîna di ko.wikipedia.org de
- Bikaranîna di ms.wikipedia.org de
- Bikaranîna di pt.wikipedia.org de
- Bikaranîna di ru.wikipedia.org de
- Bikaranîna di rw.wikipedia.org de
- Bikaranîna di tr.wikipedia.org de
- Bikaranîna di zh.wikipedia.org de