File:20211109 Frequency of extreme weather for different degrees of global warming - bar chart IPCC AR6 WG1 SPM.svg
跳转到导航
跳转到搜索

此SVG文件的PNG预览的大小:800 × 450像素。 其他分辨率:320 × 180像素 | 640 × 360像素 | 1,024 × 576像素 | 1,280 × 720像素 | 2,560 × 1,440像素 | 1,200 × 675像素。
原始文件 (SVG文件,尺寸为1,200 × 675像素,文件大小:5 KB)
说明
说明
添加一行文字以描述该文件所表现的内容
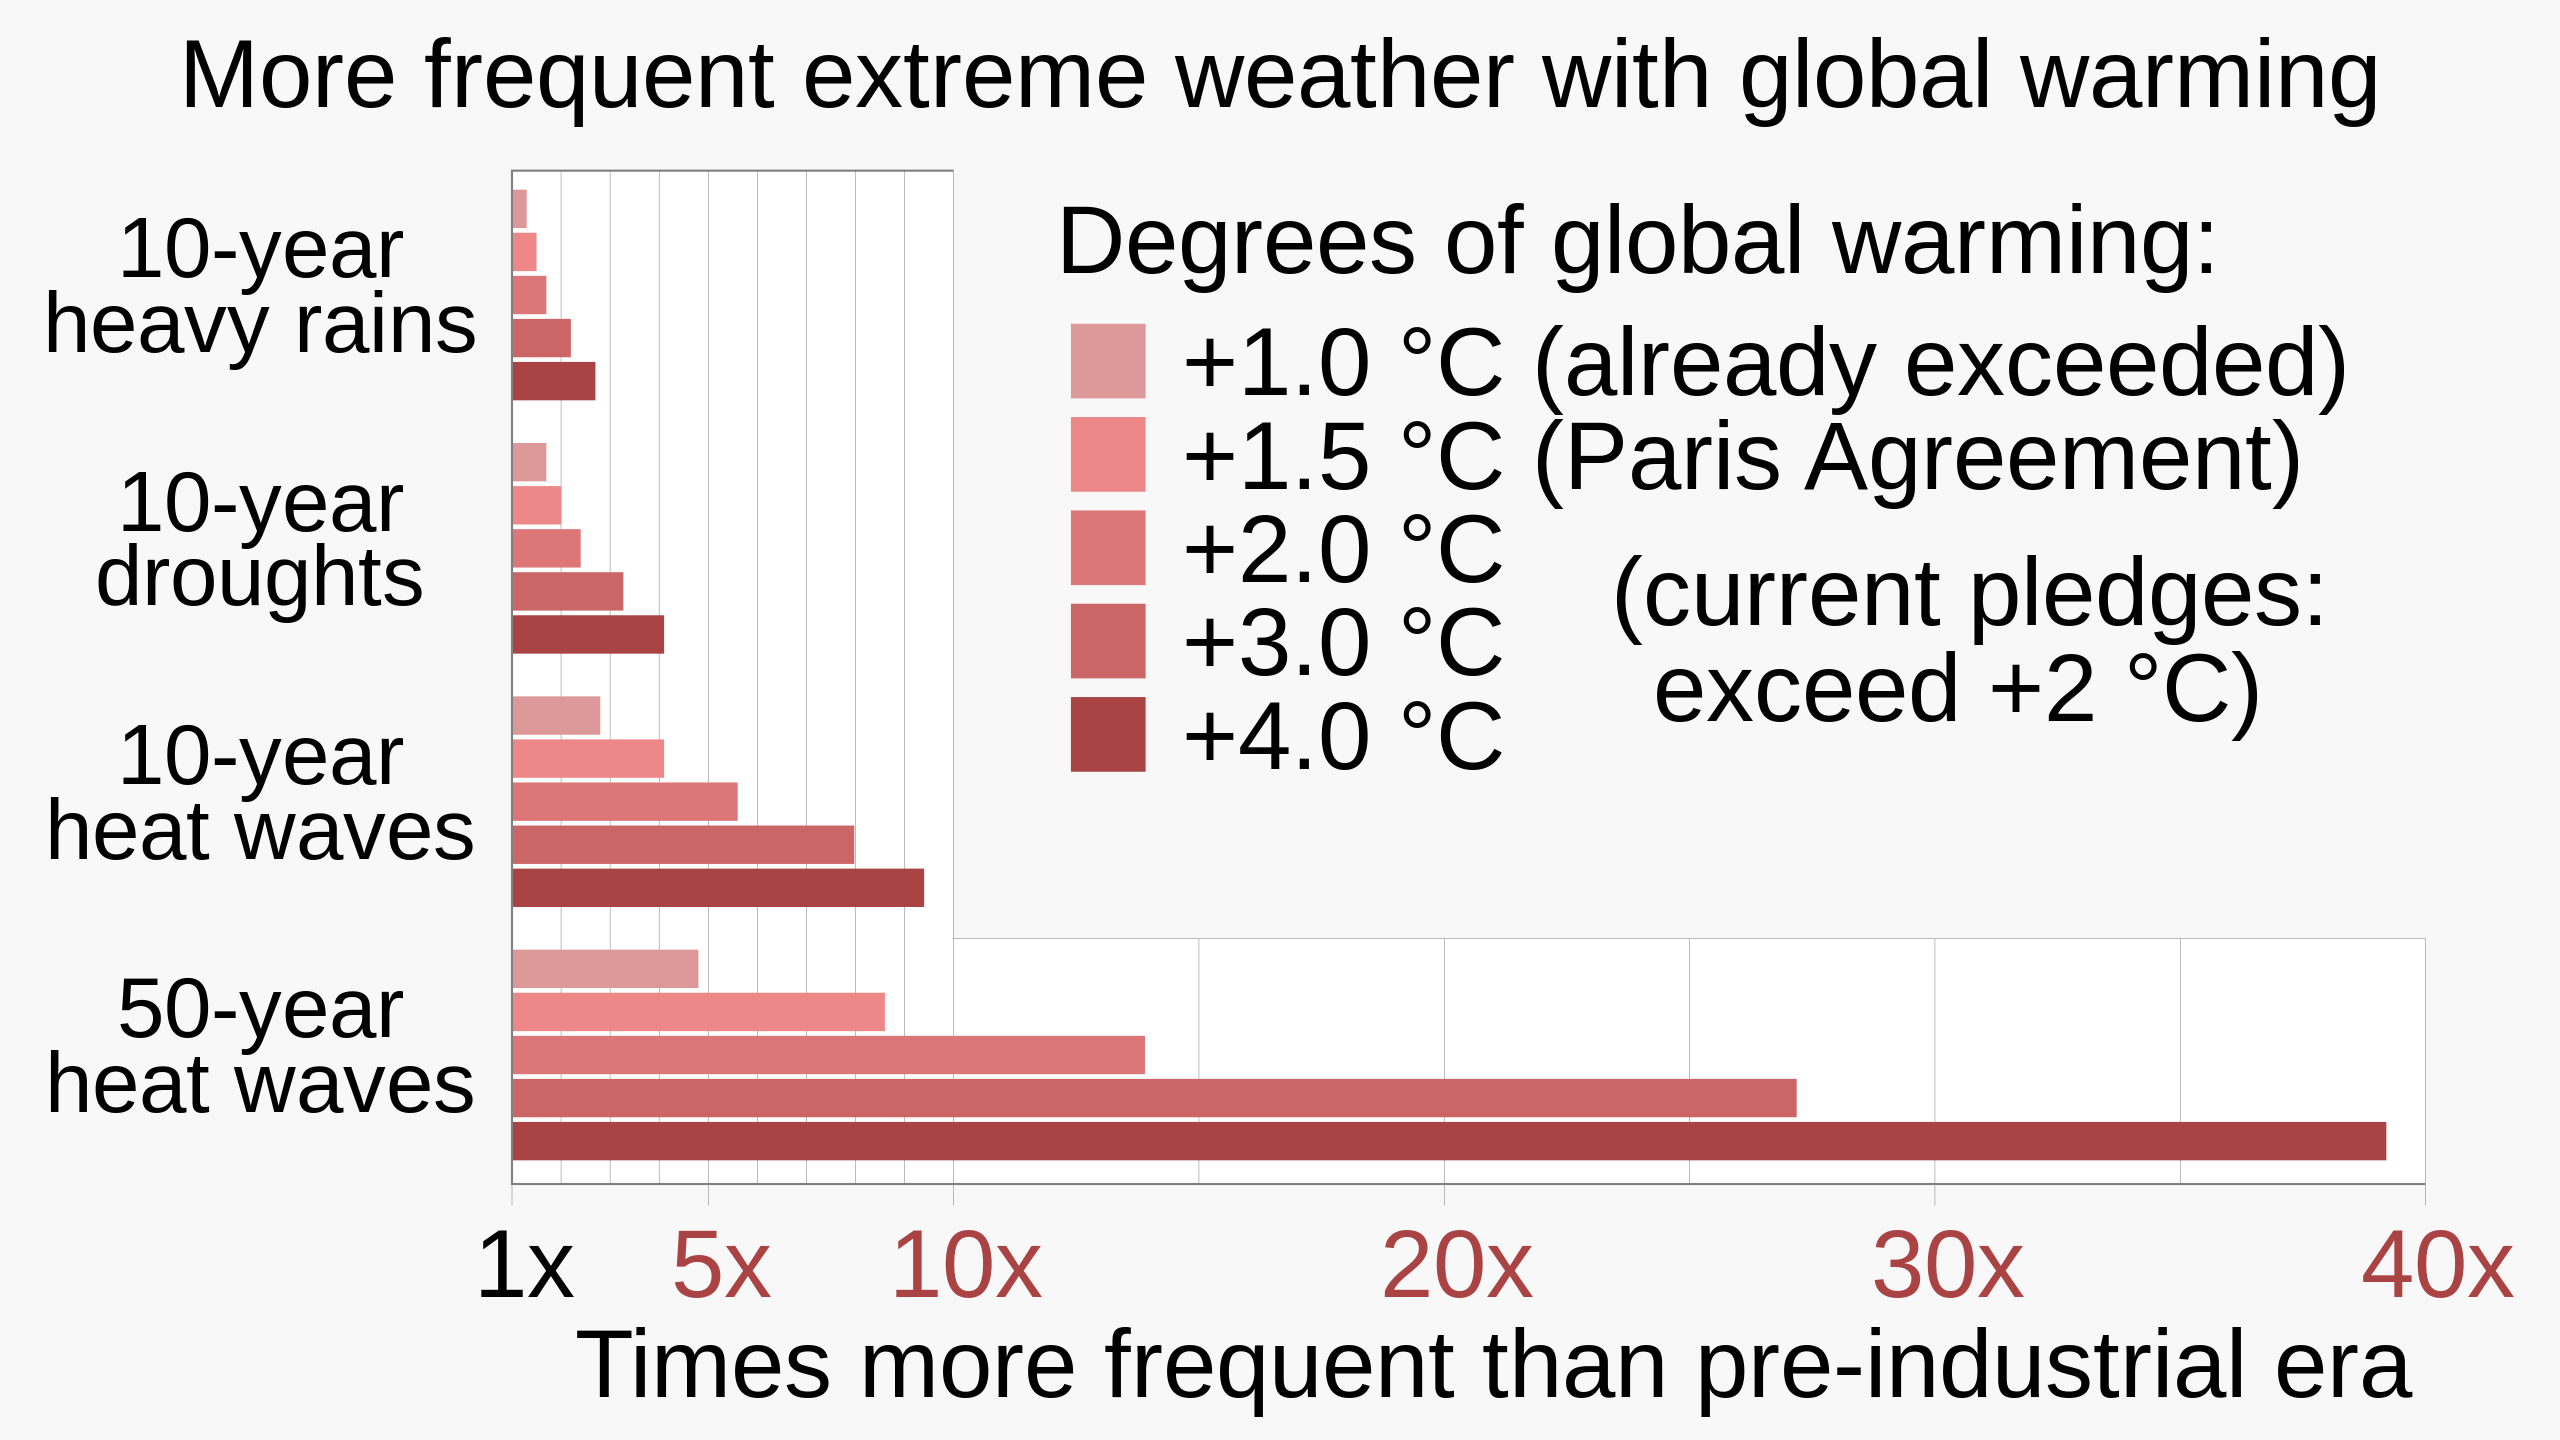
Bar chart showing frequency of extreme weather for different degrees of global warming, based on data from IPCC AR6 WG1 SPM
摘要[编辑]
| 描述 |
English: Bar chart showing frequency of extreme weather for different degrees of global warming, based on data from IPCC AR6 WG1 SPM (Summary for Policy Makers).
|
||||
| 日期 | |||||
| 来源 | 自己的作品 | ||||
| 作者 | RCraig09 | ||||
| 其他版本 |
|


Related files[编辑]
The following files are based on Fig. SPM.6 of the Sixth Assessment Report of the Intergovernmental Panel on Climate Change / Summary for Policymakers:
-
 20210809 Projected extremes for different degrees of global warming - IPCC AR6 WG1 SPM.svg
9 August 2021: Line chart of 10- and 50-year datasets (includes frequency, omits intensity) -
 20211107 Projected extremes for different degrees of global warming - 3x10yr area chart - IPCC AR6 WG1 SPM.svg
7 Nov 2021: "L" charts includes both frequency and intensity of the 10-year datasets (omits 50-year dataset) -
 20211109 Frequency of extreme weather for different degrees of global warming - bar chart IPCC AR6 WG1 SPM.svg
9 Nov 2021: Bar chart of 10- and 50-year datasets (includes frequency, omits intensity) -
 20220208 Projected temperature extremes for different degrees of global warming - orthogonal bar chart - IPCC AR6 WG1 SPM.svg
Orthogonal bar chart of 10-year heat waves (only)


许可协议[编辑]
我,本作品著作权人,特此采用以下许可协议发表本作品:
本文件采用知识共享署名-相同方式共享 4.0 国际许可协议授权。
- 您可以自由地:
- 共享 – 复制、发行并传播本作品
- 修改 – 改编作品
- 惟须遵守下列条件:
- 署名 – 您必须对作品进行署名,提供授权条款的链接,并说明是否对原始内容进行了更改。您可以用任何合理的方式来署名,但不得以任何方式表明许可人认可您或您的使用。
- 相同方式共享 – 如果您再混合、转换或者基于本作品进行创作,您必须以与原先许可协议相同或相兼容的许可协议分发您贡献的作品。
文件历史
点击某个日期/时间查看对应时刻的文件。
| 日期/时间 | 缩略图 | 大小 | 用户 | 备注 | |
|---|---|---|---|---|---|
| 当前 | 2023年7月29日 (六) 20:44 | | 1,200 × 675(5 KB) | RCraig09(留言 | 贡献) | Version 12: remove <tspan> declarations embedded within <text> in the title "More frequent...", to work around ongoing text rendering problems on Wikimedia |
| 2023年7月29日 (六) 20:29 |  | 1,200 × 675(5 KB) | RCraig09(留言 | 贡献) | Version 11: manually changing "+1.1 °C today" to "(already exceeded)" (in the English language portion) to future-proof this graphic . . . . retained JP translation <switch> elements without change | |
| 2022年9月6日 (二) 04:57 |  | 1,200 × 675(5 KB) | Icosohedral(留言 | 贡献) | File uploaded using svgtranslate tool (https://svgtranslate.toolforge.org/). Added translation for zh. | |
| 2021年12月21日 (二) 17:19 |  | 1,200 × 675(3 KB) | RCraig09(留言 | 贡献) | Version 9: misc changes per suggestions on this file's Talk page. | |
| 2021年11月22日 (一) 05:31 |  | 1,200 × 675(3 KB) | RCraig09(留言 | 贡献) | Version 8: more exact 3.0 C values . . . colors of horizontal axis tick labels | |
| 2021年11月18日 (四) 03:40 |  | 1,200 × 675(3 KB) | RCraig09(留言 | 贡献) | Version 7: adding to legend, 2.7 C under current pledges, per discussions at en.wp's Talk:Climate change | |
| 2021年11月17日 (三) 04:58 |  | 1,200 × 675(4 KB) | RCraig09(留言 | 贡献) | Version 6: Enlarge some font sizes . . . . change some text | |
| 2021年11月16日 (二) 06:07 |  | 1,200 × 675(4 KB) | RCraig09(留言 | 贡献) | Version 5: Used Liberation Sans . . . changed legend to "Present-day =+1.1 C" | |
| 2021年11月13日 (六) 18:25 |  | 1,200 × 675(4 KB) | RCraig09(留言 | 贡献) | Version 4: includes thinner, white vertical gridlines that overlay the colored bars, to make it easier to determine extent of the bars. Darker, wider gridlines remain behind the gridlines so they're visible over the white background. | |
| 2021年11月13日 (六) 04:21 |  | 1,200 × 675(4 KB) | RCraig09(留言 | 贡献) | Version 3: reduced length of some vertical grid lines; removed most of the plot-area outline. |
您不可以覆盖此文件。
文件用途
以下6个页面使用本文件:
- User:RCraig09
- File:20210809 Projected extremes for different degrees of global warming - IPCC AR6 WG1 SPM.svg
- File:20211107 Projected extremes for different degrees of global warming - 3x10yr area chart - IPCC AR6 WG1 SPM.svg
- File:20211109 Frequency of extreme weather for different degrees of global warming - bar chart IPCC AR6 WG1 SPM.svg
- File:20211109 Frequency of extreme weather for different degrees of global warming - bar chart IPCC AR6 WG1 SPM cs.svg
- File:20220208 Projected temperature extremes for different degrees of global warming - orthogonal bar chart - IPCC AR6 WG1 SPM.svg
全域文件用途
以下其他wiki使用此文件:
- bn.wikipedia.org上的用途
- de.wikipedia.org上的用途
- en.wikipedia.org上的用途
- eo.wikipedia.org上的用途
- ko.wikipedia.org上的用途
- ms.wikipedia.org上的用途
- pt.wikipedia.org上的用途
- ru.wikipedia.org上的用途
- rw.wikipedia.org上的用途
- tr.wikipedia.org上的用途
- zh.wikipedia.org上的用途