File:Action potential8.jpg
Jump to navigation
Jump to search
Size of this preview: 579 × 599 pixels. Other resolutions: 232 × 240 pixels | 464 × 480 pixels | 742 × 768 pixels | 1,237 × 1,280 pixels.
Original file (1,237 × 1,280 pixels, file size: 189 KB, MIME type: image/jpeg)
Captions
Captions
Add a one-line explanation of what this file represents
Summary
[edit]
| Description |
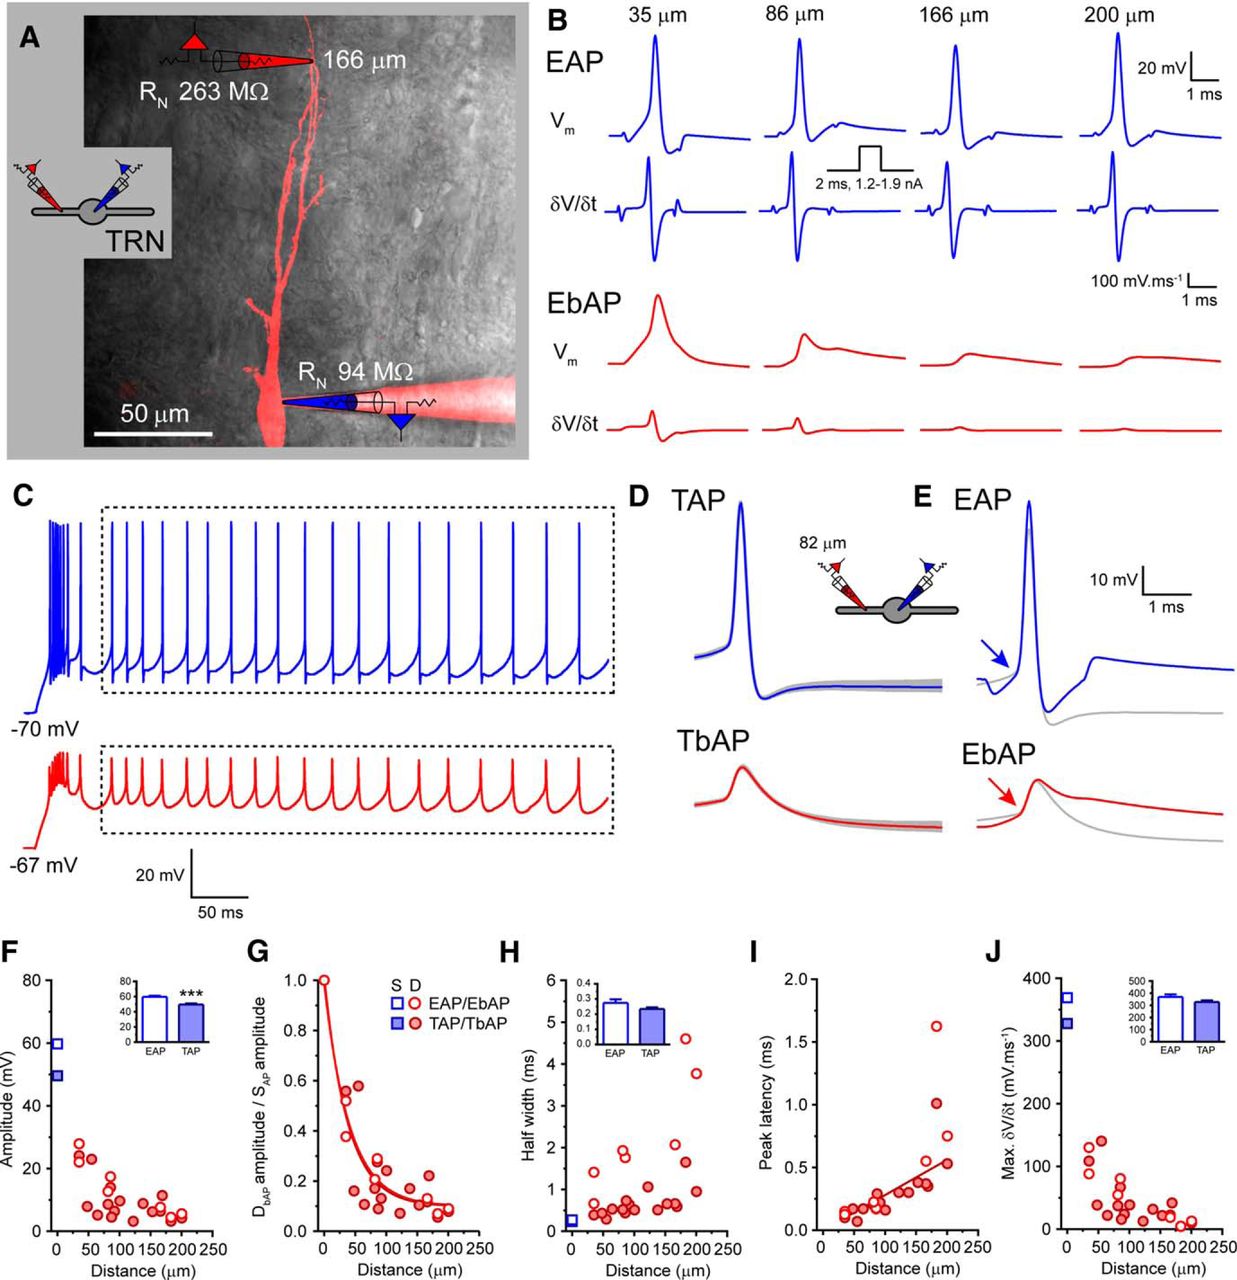
English: Tonic AP backpropagation in TRN neurons. A, Overlay of two-photon fluorescence maximum intensity projection and scanning gradient contrast image of a somatosensory TRN neuron showing the location of the somatic (blue) and dendritic (red) recording pipettes. Inset, Schematic of the recording configuration illustrating the neuron recorded from (TRN) and the placement of electrodes. This schematic is used throughout to indicate that the illustrated data are drawn from TRN neuron recordings. B, Vm and δV/δt for APs evoked by brief somatic current injections recorded in the dendrites (EbAP, red) of four different TRN neurons at increasing distances from the soma (EAP, blue). C, Typical train of tonic APs recorded in the soma (TAP, blue) and dendrites (TbAP, red) of a TRN neuron evoked by a prolonged somatic current injection step. Dashed boxes enclose those spikes included for analysis. D, Gray traces show overlaid the individual TAPs and TbAPs measured from the period indicated by the dashed box in C. The blue and red traces are the average TAP and TbAP, respectively. E, EAP (blue) and EbAP (red) recorded at the same dendritic location in the same TRN neuron compared with the average TAP and TbAP (gray traces). F, Amplitude of EAPs (open blue squares) and EbAPs (open red circles) and TAPs (filled blue squares) and TbAPs (filled red circles) versus recording distance from soma. For clarity, somatic values are mean ± SEM. Inset bar chart shows significant difference in mean somatic EAPs and TAP amplitude. G, Normalized dendritic EbAP (EbAP/EAP) and TbAP (TbAP/TAP) amplitude versus recording distance from soma. H, EAP and EbAP and TAP and TbAP half-width versus recording distance from soma. Inset shows no significant increase in somatic half-width for TAPs versus EAPs. I, Peak latency between EAPs and EbAPs and TAPs and TbAPs versus distance from the soma (J) Maximum δV/δt versus distance from the soma for EAPs and EbAPs and TAPs and TbAPs. Inset shows no significant difference the in somatic maximum δV/δt for TAPs versus EAPs. |
| Date | |
| Source | https://doi.org/10.1523/JNEUROSCI.0015-17.2017 |
| Author | William M. Connelly, Vincenzo Crunelli, and Adam C. Errington |
Licensing
[edit]
This file is licensed under the Creative Commons Attribution-Share Alike 4.0 International license.
- You are free:
- to share – to copy, distribute and transmit the work
- to remix – to adapt the work
- Under the following conditions:
- attribution – You must give appropriate credit, provide a link to the license, and indicate if changes were made. You may do so in any reasonable manner, but not in any way that suggests the licensor endorses you or your use.
- share alike – If you remix, transform, or build upon the material, you must distribute your contributions under the same or compatible license as the original.
File history
Click on a date/time to view the file as it appeared at that time.
| Date/Time | Thumbnail | Dimensions | User | Comment | |
|---|---|---|---|---|---|
| current | 07:55, 31 August 2021 | | 1,237 × 1,280 (189 KB) | Neuroscience49 (talk | contribs) | Uploaded a work by William M. Connelly, Vincenzo Crunelli, and Adam C. Errington from https://doi.org/10.1523/JNEUROSCI.0015-17.2017 with UploadWizard |
You cannot overwrite this file.
File usage on Commons
There are no pages that use this file.
File usage on other wikis
The following other wikis use this file:
- Usage on vi.wikipedia.org