File:Antarctic Temperature Trend 1981-2007.jpg
跳转到导航
跳转到搜索
没有更高的分辨率。
Antarctic_Temperature_Trend_1981-2007.jpg (540 × 508像素,文件大小:93 KB,MIME类型:image/jpeg)
说明
说明
添加一行文字以描述该文件所表现的内容
摘要
[编辑]
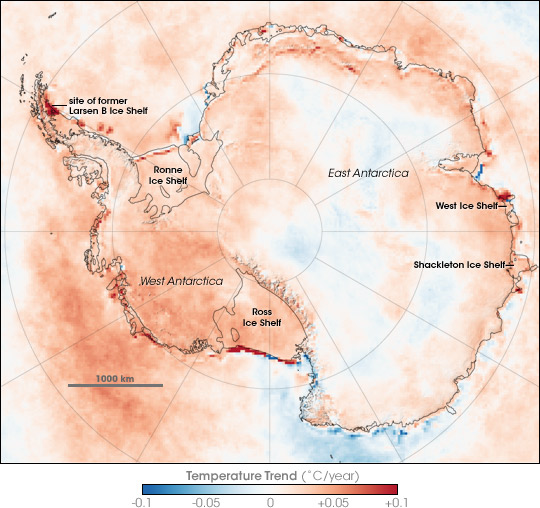
| 描述 | Map showing Antarctic Skin Temperature Trends between 1981 and 2007. Skin temperature is roughly the top one millimeter of land, sea, snow, or ice. Across most of the Antarctic the temperature increased, in some areas warming approaching 2 degrees Celsius during the period. The map is based on thermal infrared (heat) observations made by a series of NOAA satellite sensors. None of the sensors were in orbit at the same time, so scientists could not compare simultaneous observations from different sensors to make sure each was recording temperatures exactly the same. Instead, the team checked the satellite records against ground-based weather station data to inter-calibrate them and make the 26-year satellite record. The level of uncertainty is between 2 and 3 degrees Celsius. The most dramatic changes are the red areas associated with iceberg calving and the collapse of the Larsen B ice shelf. In these cases, the satellites saw a change from cold ice to relatively warm open water. |
| 日期 | |
| 来源 | en:Internet Archive - https://web.archive.org/web/20070823123915/http://earthobservatory.nasa.gov/Newsroom/NewImages/images.php3?img_id=17838 (originally http://earthobservatory.nasa.gov/Newsroom/NewImages/images.php3?img_id=17838 NASA Earth Observatory) |
| 作者 | Robert Simmon |
| 其他版本 | العربيَّة |
许可协议
[编辑]
| 本文件完全由NASA创作,在美国属于公有领域。根据NASA的版权方针,NASA的材料除非另有声明否则不受版权保护。(参见Template:PD-USGov/zh、NASA版权方针页面或JPL图片使用方针。) | ||
 |
警告:
|
文件历史
点击某个日期/时间查看对应时刻的文件。
| 日期/时间 | 缩略图 | 大小 | 用户 | 备注 | |
|---|---|---|---|---|---|
| 当前 | 2007年11月21日 (三) 22:13 | | 540 × 508(93 KB) | Sagredo(留言 | 贡献) | {{Information |Description=Map showing Antarctic Skin Surface Temperature Trends 1981-2007. Skin temperature is roughly the top one millimeter of land, sea, snow, or ice. Across most of the Antarctic the temperature increased, in some areas approachi |
您不可以覆盖此文件。
文件用途
全域文件用途
以下其他wiki使用此文件:
- ar.wikipedia.org上的用途
- ast.wikipedia.org上的用途
- ca.wikipedia.org上的用途
- el.wikipedia.org上的用途
- en.wikipedia.org上的用途
- eo.wikipedia.org上的用途
- es.wikipedia.org上的用途
- gl.wikipedia.org上的用途
- ja.wikipedia.org上的用途
- mk.wikipedia.org上的用途
- nl.wikipedia.org上的用途
- nn.wikipedia.org上的用途
- pa.wikipedia.org上的用途
- pl.wikipedia.org上的用途
- ur.wikipedia.org上的用途
- vi.wikipedia.org上的用途
- zh.wikipedia.org上的用途