Category:Environmental trends
Jump to navigation
Jump to search
Subcategories
This category has the following 6 subcategories, out of 6 total.
Media in category "Environmental trends"
The following 39 files are in this category, out of 39 total.
-
Aletsch Glacier animation.gif 992 × 654; 1.01 MB
-
Antarctic Temperature Trend 1951-2006v3.jpg 378 × 494; 53 KB
-
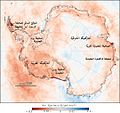
Antarctic Temperature Trend 1981-2007-ar.jpg 540 × 508; 104 KB
-
Antarctic Temperature Trend 1981-2007.jpg 540 × 508; 93 KB
-
Arctic climate-ice-seaice-extent-trend-sep04.png 420 × 240; 3 KB
-
Average March Arctic sea ice extent for 1979 through 2008.png 1,800 × 1,193; 163 KB
-
BAMS climate assess boulder water vapor 2002 - 2.png 775 × 425; 12 KB
-
BAMS climate assess boulder water vapor 2002.png 775 × 425; 9 KB
-
CanadaGooseTrend19662003.png 578 × 447; 12 KB
-
Dynamique de population proie-prédateur.jpg 562 × 366; 59 KB
-
DérangementDisturbing.png 3,037 × 5,184; 610 KB
-
Extinction Intensity Full.png 577 × 406; 51 KB
-
Glaciermassbalance.JPG 685 × 448; 40 KB
-
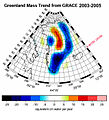
Greenland Ice Mass Trend.jpg 1,268 × 1,392; 613 KB
-
Hist east pac ACE trend 1971-2012.gif 667 × 501; 122 KB
-
Hurricane strikes on US.JPG 554 × 373; 41 KB
-
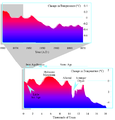
Iceage time 18kyr and 120yr.png 1,282 × 1,334; 52 KB
-
Iceage time 18kyr.png 1,026 × 632; 27 KB
-
Iceage time-slice hg.png 3,208 × 2,074; 150 KB
-
Intermediate Disturbance Hypothesis Graph.svg 512 × 384; 21 KB
-
Klimadiagramm hadley 1850 2009.svg 1,000 × 700; 39 KB
-
Marronniers date.jpg 2,586 × 1,210; 600 KB
-
NHC Atlantic Forecast Error Trends - 2.png 1,210 × 950; 24 KB
-
NHC Atlantic Forecast Error Trends.png 1,750 × 1,313; 1.4 MB
-
Northern Forest Trend in Photosynthetic Activity.gif 4,119 × 2,945; 596 KB
-
Northern Forest Trend in Photosynthetic Activity.jpg 4,119 × 2,945; 2.98 MB
-
Pristimantis richness area relationship.jpg 1,512 × 1,154; 189 KB
-
Pristimantis richness by biogeographic region.jpg 1,317 × 2,197; 796 KB
-
Proxy-based temperature reconstruction(500AD~2000AD).png 720 × 237; 19 KB
-
Puzzle arctic sea ice extents.gif 686 × 501; 76 KB
-
Satellite Temperatures.png 2,400 × 1,590; 297 KB
-
Southern Hemisphere Sea Ice Extent Anomalies 2010 11.png 1,260 × 720; 220 KB
-
Southern Hemisphere Sea Ice Extent Anomalies 2010 Ita.png 1,260 × 720; 121 KB
-
Southern Hemisphere Sea Ice Extent Anomalies.png 1,260 × 720; 127 KB
-
Svalbard temperature.png 976 × 579; 96 KB
-
Temperature difference 400kyr.png 1,301 × 285; 29 KB
-
Temperature variation 800kyr.png 676 × 252; 33 KB
-
Uranium and thorium release from coal combustion.gif 340 × 349; 33 KB
-
Younger Dryas temperature variation.png 1,026 × 632; 27 KB


