File:Atmospheric Transmission.svg
- Fichier
- Historique du fichier
- Utilisations locales du fichier
- Utilisations du fichier sur d’autres wikis
- Métadonnées

Fichier d’origine (Fichier SVG, nominalement de 741 × 724 pixels, taille : 321 kio)
Légendes
Légendes
Sommaire
Description
[modifier]| DescriptionAtmospheric Transmission.svg |
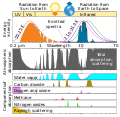
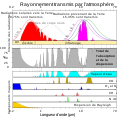
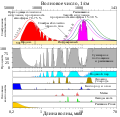
English: This figure shows the absorption bands in the Earth's atmosphere (middle panel) and the effect that this has on both solar radiation and upgoing thermal radiation (top panel). Individual absorption spectrum for major greenhouse gases plus Rayleigh scattering are shown in the lower panel. |
| Date | |
| Source | This figure was prepared by Robert A. Rohde for the Global Warming Art project. |
| Auteur | Д.Ильин: vectorization (File:Atmospheric Transmission-ru.svg); Cepheiden translation back to english |
| Autres versions |
[modifier] .svg:
.png:
|
| Ce fichier SVG contient du texte encapsulé pouvant facilement être traduit dans votre langue en utilisant n'importe quel éditeur de fichier SVG ou de texte, ou par l'outil de traduction de fichiers SVG. Pour plus d'informations, voir : A propos de la traduction des fichiers SVG. |
This figure shows the absorption bands in the Earth's atmosphere (middle panel) and the effect that this has on both solar radiation and upgoing thermal radiation (top panel). Individual absorption spectrum for major greenhouse gases plus Rayleigh scattering are shown in the lower panel.
Both the Earth and the Sun emit electromagnetic radiation (e.g. light) that closely follows a blackbody spectrum, and which can be predicted based solely on their respective temperatures. For the Sun, these emissions peak in the visible region and correspond to a temperature of ~5500 K. Emissions from the Earth vary following variations in temperature across different locations and altitudes, but always peak in the infrared.
The position and number of absorption bands are determined by the chemical properties of the gases present. In the present atmosphere, water vapor is the most significant of these greenhouse gases, followed by carbon dioxide and various other minor greenhouse gases. In addition, Rayleigh scattering, the physical process that makes the sky blue, also disperses some incoming sunlight. Collectively these processes capture and redistribute 25-30% of the energy in direct sunlight passing through the atmosphere. By contrast, the greenhouse gases capture 70-85% of the energy in upgoing thermal radiation emitted from the Earth surface.
Data sources and notes
[modifier]The data used for these figures is based primarily on Spectral Calculator of GATS, Inc. copie d'archive sur Wayback Machine which implements the LINEPAK system of calculating absorption spectra (Gordley et al. 1994) from the HITRAN2004 (Rothman et al. 2004) spectroscopic database. To aid presentation, the absorption spectra were smoothed. Features with a bandwidth narrower than 0.5% of their wavelength may be obscured.
Calculations were done on the assumption of direct vertical transmission through an atmosphere with gas concentrations representative of modern day averages. In particular, absorption would be greater for radiation traveling obliquely through the atmosphere as it would encounter more gas.
The total scattering and absorption curve includes only the components indicated in the lower panel. These represent the vast majority of absorption contributing to the greenhouse effect and follow the treatment of Peixoto and Oort (1992), but other minor species such as carbon monoxide, nitric oxide and chloroflourocarbons (CFCs) have been omitted. Also omitted was scattering due to aerosols and other sources besides Rayleigh scattering.
The peaks in the blackbody spectra were adjusted to have the same height for ease in presentation.
Conditions d’utilisation
[modifier]| Ce fichier est disponible selon les termes de la licence Creative Commons CC0 Don universel au domaine public. | |
| La personne qui a associé une œuvre avec cet acte l’a placée dans le domaine public en renonçant mondialement à tous ses droits sur cette œuvre en vertu des lois relatives au droit d’auteur, ainsi qu’à tous les droits juridiques connexes et voisins qu’elle possédait sur l’œuvre, sans autre limite que celles imposées par la loi. Vous pouvez copier, modifier, distribuer et utiliser cette œuvre, y compris à des fins commerciales, sans qu’il soit nécessaire d’en demander la permission.
http://creativecommons.org/publicdomain/zero/1.0/deed.enCC0Creative Commons Zero, Public Domain Dedicationfalsefalse |
References
[modifier]- Gordley, Larry L., Benjamin T. Marshall, Allen D. Chu (1994). "LINEPAK: Algorithms for modeling spectral transmittance and radiance". Journal of Quantitative Spectroscopy & Radiative Transfer 52 (5): 563-580.
- L.S. Rothman, D. Jacquemart, A. Barbe, D. Chris Benner, M. Birk, L.R. Brown, M.R. Carleer, C. Chackerian Jr., K. Chance, L.H. Coudert, V. Dana, V.M. Devi, J.-M. Flaud, R.R. Gamache, A. Goldman, J.-M. Hartmann, K.W. Jucks, A.G. Maki, J.-Y. Mandin, S.T. Massie, J. Orphal, A. Perrin, C.P. Rinsland, M.A.H. Smith, J. Tennyson, R.N. Tolchenov, R.A. Toth, J. Vander Auwera, P. Varanasi, G. Wagner (2004). "The HITRAN 2004 molecular spectroscopic database". Journal of Quantitative Spectroscopy & Radiative Transfer 96: 139-204.
- Peixoto, Jose P. and Abraham H. Oort (1992) Physics of Climate, Springer ISBN : 0883187124.
Other versions
[modifier][modifier]
.svg:
-
anglais .svg
-
français .svg
-
macédonien .svg
-
russe .svg
-
coréen .svg
.png:
-
anglais .png
-
français .png
-
polonais .png
-
japonais .png
-
arabe .png
Historique du fichier
Cliquer sur une date et heure pour voir le fichier tel qu'il était à ce moment-là.
| Date et heure | Vignette | Dimensions | Utilisateur | Commentaire | |
|---|---|---|---|---|---|
| actuel | 18 avril 2023 à 16:19 |  | 741 × 724 (321 kio) | Efbrazil (d | contributions) | Adding white background color so renders correctly on smartphone |
| 7 août 2022 à 20:29 |  | 741 × 724 (321 kio) | Efbrazil (d | contributions) | color bug fix | |
| 7 août 2022 à 20:00 |  | 741 × 724 (321 kio) | Efbrazil (d | contributions) | Fixed translations as best as possible using text editor for new layout | |
| 7 août 2022 à 19:34 |  | 741 × 724 (320 kio) | Efbrazil (d | contributions) | Fixing text alignment | |
| 7 août 2022 à 19:26 |  | 741 × 724 (320 kio) | Efbrazil (d | contributions) | Graphical improvements as per discussion page | |
| 17 février 2022 à 17:59 |  | 741 × 724 (208 kio) | Pierre cb (d | contributions) | File uploaded using svgtranslate tool (https://svgtranslate.toolforge.org/). Added translation for fr. | |
| 18 mars 2021 à 22:10 |  | 741 × 724 (180 kio) | Cepheiden (d | contributions) | german labels adjusted | |
| 18 mars 2021 à 22:09 |  | 741 × 724 (180 kio) | Cepheiden (d | contributions) | correction of labels | |
| 18 mars 2021 à 22:06 |  | 741 × 724 (180 kio) | Cepheiden (d | contributions) | File uploaded using svgtranslate tool (https://svgtranslate.toolforge.org/). Added translation for de. | |
| 18 mars 2021 à 21:52 |  | 741 × 724 (154 kio) | Cepheiden (d | contributions) | =={{int:filedesc}}== {{Information |description= {{en|1=This figure shows the absorption bands in the Earth's atmosphere (middle panel) and the effect that this has on both solar radiation and upgoing thermal radiation (top panel). Individual absorption spectrum for major greenhouse gases plus Rayleigh scattering are shown in the lower panel.}} |date=2021-03-18 |source=This figure was prepared by Robert A. Rohde for the Global Warming Art project. |author=[[User:Д.Ил... |
Vous ne pouvez pas remplacer ce fichier.
Utilisations locales du fichier
Aucune page n’utilise ce fichier.
Utilisations du fichier sur d’autres wikis
Les autres wikis suivants utilisent ce fichier :
- Utilisation sur ar.wikipedia.org
- Utilisation sur de.wikipedia.org
- Utilisation sur el.wikipedia.org
- Utilisation sur en.wikipedia.org
- Utilisation sur fr.wikipedia.org
- Utilisation sur gl.wikipedia.org
- Utilisation sur ha.wikipedia.org
- Utilisation sur ig.wikipedia.org
- Utilisation sur pt.wikipedia.org
- Utilisation sur simple.wikipedia.org
- Utilisation sur zh.wikipedia.org
Métadonnées
Ce fichier contient des informations supplémentaires, probablement ajoutées par l'appareil photo numérique ou le numériseur utilisé pour le créer.
Si le fichier a été modifié depuis son état original, certains détails peuvent ne pas refléter entièrement l'image modifiée.
| Largeur | 209.02632mm |
|---|---|
| Hauteur | 204.44635mm |


