File:Autofocus phase detection.svg
ナビゲーションに移動
検索に移動

この SVG ファイルのこの PNG プレビューのサイズ: 512 × 341 ピクセル. その他の解像度: 320 × 213 ピクセル | 640 × 426 ピクセル | 1,024 × 682 ピクセル | 1,280 × 853 ピクセル | 2,560 × 1,705 ピクセル。
元のファイル (SVG ファイル、512 × 341 ピクセル、ファイルサイズ: 7キロバイト)
キャプション
キャプション
このファイルの内容を1行で記述してください
概要[編集]
| 解説 |
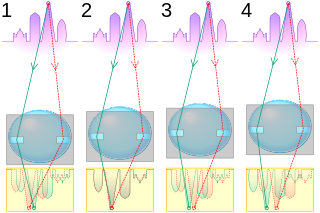
English: Illustration of autofocus using phase detection. In each figure, the purple circle represents the object to be focused on, the red and green lines represent light rays passing through apertures at the opposite sides of the lens, the yellow rectangle represents sensor arrays (one for each aperture), and the graph represents the intensity profile as seen by each sensor array. Figures 1 to 4 represent conditions where the lens is focused (1) too near, (2) correctly, (3) too far and (4) way too far. It can be seen from the graphs that the phase difference between the two profiles can be used to determine not just in which direction, but how much to move the lens to achieve optimal focus. Note: The figures are not to scale, and colours are used purely for clarity and do not represent any particular wavelength.
Italiano: Illustrazione di autofocus con rilevazione di fase. In ciascuna figura, il cerchio viola rappresenta l'oggetto da mettere a fuoco, le linee rosse e verdi rappresentano raggi di luce che passano attraverso aperture ai lati opposti della lente, il rettangolo giallo rappresenta la matrice di sensori (uno per ciascuna apertura) ed il grafico rappresenta il profilo di intensità visto da ogni matrice di sensori. Le figure da 1 a 4 rappresentano le condizioni in cui si concentra la lente (1) troppo vicino, (2) correttamente, (3) troppo e (4) troppo lontano. Si può vedere dai grafici che la differenza di fase tra i due profili può essere utilizzato per determinare non solo in quale direzione, ma anche di quanto bisogna spostare l'obiettivo per ottenere il fuoco ottimale. Nota: Le figure non sono in scala, ed i colori vengono utilizzati unicamente per chiarezza e non rappresentano qualsiasi lunghezza d'onda particolare. |
| 原典 | 投稿者自身による著作物 |
| 作者 | Cmglee |
ライセンス[編集]
この作品の著作権者である私は、この作品を以下のライセンスで提供します。
このファイルはクリエイティブ・コモンズ 表示-継承 3.0 非移植ライセンスのもとに利用を許諾されています。
- あなたは以下の条件に従う場合に限り、自由に
- 共有 – 本作品を複製、頒布、展示、実演できます。
- 再構成 – 二次的著作物を作成できます。
- あなたの従うべき条件は以下の通りです。
- 表示 – あなたは適切なクレジットを表示し、ライセンスへのリンクを提供し、変更があったらその旨を示さなければなりません。これらは合理的であればどのような方法で行っても構いませんが、許諾者があなたやあなたの利用行為を支持していると示唆するような方法は除きます。
- 継承 – もしあなたがこの作品をリミックスしたり、改変したり、加工した場合には、あなたはあなたの貢献部分を元の作品とこれと同一または互換性があるライセンスの下に頒布しなければなりません。

|
この文書は、フリーソフトウェア財団発行のGNUフリー文書利用許諾書 (GNU Free Documentation License) 1.2またはそれ以降のバージョンの規約に基づき、複製や再配布、改変が許可されます。不可変更部分、表紙、背表紙はありません。このライセンスの複製は、GNUフリー文書利用許諾書という章に含まれています。 |
あなたは上記のライセンスから、どれか一つ以上を選択できます。
ファイルの履歴
過去の版のファイルを表示するには、その版の日時をクリックしてください。
| 日付と時刻 | サムネイル | 寸法 | 利用者 | コメント | |
|---|---|---|---|---|---|
| 現在の版 | 2017年8月24日 (木) 21:21 | | 512 × 341 (7キロバイト) | Cmglee (トーク | 投稿記録) | Make background opaque. |
| 2017年8月24日 (木) 21:20 |  | 512 × 341 (7キロバイト) | Cmglee (トーク | 投稿記録) | Use more realistic profiles. | |
| 2013年1月16日 (水) 20:35 | 512 × 1,280 (5キロバイト) | Cmglee (トーク | 投稿記録) | Fix lens movement and add decoration. | ||
| 2012年4月1日 (日) 00:09 |  | 512 × 1,024 (5キロバイト) | Cmglee (トーク | 投稿記録) | {{Information |Description ={{en|1=Illustration of autofocus using phase detection. In each figure, the purple circle represents the object to be focused on, the red and green rays represent light rays passing through apertures at the extreme sides ... |
このファイルは上書きできません。
ファイルの使用状況
以下のページがこのファイルを使用しています:
グローバルなファイル使用状況
以下に挙げる他のウィキがこの画像を使っています:
- en.wikipedia.org での使用状況
- fa.wikipedia.org での使用状況
- fi.wikipedia.org での使用状況
- fr.wikibooks.org での使用状況
- it.wikipedia.org での使用状況
- ja.wikipedia.org での使用状況
- pl.wikipedia.org での使用状況