File:Baltic sea bottom salinity and distribution of Platichthys populations - fmars-05-00225-g001.jpg
Jump to navigation
Jump to search

Size of this preview: 446 × 599 pixels. Other resolutions: 178 × 240 pixels | 357 × 480 pixels | 571 × 768 pixels | 1,032 × 1,387 pixels.
Original file (1,032 × 1,387 pixels, file size: 418 KB, MIME type: image/jpeg)
Captions
Captions
Add a one-line explanation of what this file represents
Summary
[edit]
| Description |
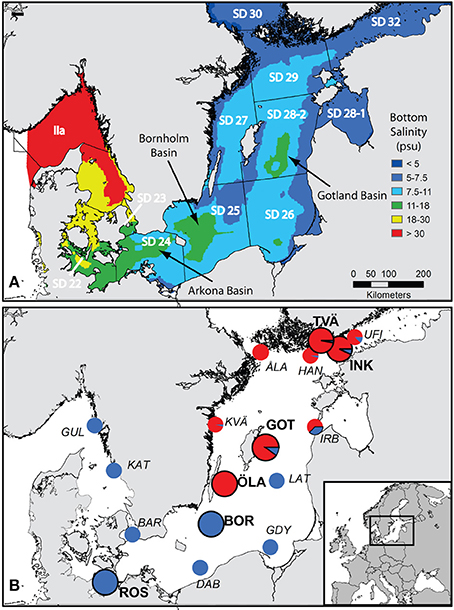
English: Original figure caption: Map of the Baltic Sea showing (A) modeled mean bottom salinity in the Baltic Sea from Bendtsen et al. (2007) and the borders and names of ICES subdivisions [i.e. SD 23, SD24, etc.]; deep-water basins where pelagic flounders can reproduce have a salinity above 11 psu (green color) and are indicated by arrows, and (B) the sampling locations from this study (large pie charts with black rings and bold text labels) and from Momigliano et al. (2017a) (small pie charts and italics text labels), with an inset showing the position of the study area within Europe. Pie charts represent the proportion of demersal flounders (P. solemdali sp. nov., in red) and pelagic flounders (P. flesus, in blue) identified by genetic tests in both studies, and thus give a contemporary snapshot of each of the two species distribution in the Baltic Sea and their relative abundance. To be noticed that P. flesus were present in almost every location (with the exception of Öland and Åland), while P. solemdali sp. nov. distribution seems not to extend to the southern Baltic Sea. Abbreviations are as follows: UFI = Helsinki, Gulf of Finland (Momigliano et al., 2017a); INK = Inkoo, Gulf of Finland (this study); TVÄ = Tvärminne, Gulf of Finland (this study); HAN = Hanko, Gulf of Finland (Momigliano et al., 2017a); ÅLA = Åland Archipelago (Momigliano et al., 2017a); IRB = Irbe Strait, Estonia (Momigliano et al., 2017a); GOT = Lausvik, Gotland (this study); KVÄ = Kvädofjärden, Sweden (Momigliano et al., 2017a); LAT = Latvian Sea, Latvia (Momigliano et al., 2017a); ÖLA = Öland, Sweden (this study; Momigliano et al., 2017a); BOR = Bornholm Basin (this study; Momigliano et al., 2017a); GDY = Gdynia, Poland (Momigliano et al., 2017a); DAB = Dabki, Poland (Momigliano et al., 2017a); ROS = Rostock, Germany (this study), BAR = Barsebäck, Sweden (Momigliano et al., 2017a); KAT = Kattegat, Sweden (Momigliano et al., 2017a); GUL = Gullmaren, Sweden (Momigliano et al., 2017a). For further details on sampling locations from this study and from Momigliano et al. (2017a) see Table 1 and Table S1. Deutsch: (sinngemäße Übersetzung der Original-Bildunterschrift) (A) Karte der mittleren Salinität des grundnahen Meerwassers der Ostsee (nach Bendtsen et al., 2007) mit Grenzen und Bezeichnungen der ICES-Einheiten (SD 23, SD24 usw.). Die tieferen Beckenbereiche, in denen sich Flundern mit „pelagischen“ Eiern fortpflanzen können, haben eine Salinität von mehr als 11 psu (grün dargestellt und durch Pfeile markiert). (B) Karte der Ostsee mit Verzeichnung der Aufsammlungsstellen der vorliegenden Studie (große Kreisdiagramme mit schwarzen Randlinien und gefetteter Beschriftung) und denen von Momigliano et al. (2017a; kleine Kreisdiagramme mit kursiver Beschriftung), mit kleiner Übersichtskarte (unten rechts), die die Lage des Untersuchungsgebietes in Europa zeigt. Die Kreisdiagramme stellen die jeweiligen Anteile der Flundern, die sich mittels zu Boden sinkender Eier fortpflanzen (P. solemdali sp. nov., rot) und solchen, die sich mittels schwebender („pelagischer“) Eier fortpflanzen (P. flesus, blau) dar, wobei die Zuordnung der gefangenen Tiere in beiden Studien anhand von Gentests erfolgte. Die Karte liefert somit eine aktuelle Momentaufnahme der geographischen Häufigkeitsverteilung der beiden Arten in der Ostsee. Es sei angemerkt, dass P. flesus nahezu überall vorkam (Ausnahmen: Öland und Åland) wohingegen das Verbreitungsgebiet von P. solemdali sp. nov. auf die nördliche Ostsee beschränkt zu sein scheint. Bedeutung der Abkürzungen: UFI = Helsinki, Finnischer Meerbusen (Momigliano et al., 2017a); INK = Inkoo, Finnischer Meerbusen (vorliegende Studie); TVÄ = Tvärminne, Finnischer Meerbusen (vorliegende Studie); HAN = Hanko, Finnischer Meerbusen (Momigliano et al., 2017a); ÅLA = Åland-Inseln (Momigliano et al., 2017a); IRB = Irbestraße, Estland (Momigliano et al., 2017a); GOT = Lausvik, Gotland (vorliegende Studie); KVÄ = Kvädofjärden, Schweden (Momigliano et al., 2017a); LAT = östliche Gotlandsee („Lettische See“), Lettland (Momigliano et al., 2017a); ÖLA = Öland, Schweden (vorliegende Studie; Momigliano et al., 2017a); BOR = Bornholmer Becken (vorliegende Studie; Momigliano et al., 2017a); GDY = Gdynia, Polen (Momigliano et al., 2017a); DAB = Dabki, Polen (Momigliano et al., 2017a); ROS = Rostock, Deutschland (vorliegende Studie), BAR = Barsebäck, Schweden (Momigliano et al., 2017a); KAT = Kattegat, Schweden (Momigliano et al., 2017a); GUL = Gullmaren, Schweden (Momigliano et al., 2017a). Für weitere Details zu den Aufsammlungsstellen der vorliegenden Studie und denen von Momigliano et al. (2017a) siehe Tabelle 1 und Tabelle S1. |
| Date | (publication date) |
| Source | fig. 1 in: Platichthys solemdali sp. nov. (Actinopterygii, Pleuronectiformes): A New Flounder Species from the Baltic Sea. Frontiers in Marine Science 5:225, 11th July 2018, doi: 10.3389/fmars.2018.00225 |
| Author | Paolo Momigliano, Gaël P. J. Denys, Henri Jokinen, Juha Merilä |
| Permission (Reusing this file) |
This image was published in an article of Frontiers in Marine Science. At the bottom of the webpage that contains the HTML version of this article (see DOI link in the source field above) it is indicated, that this article is made available under the CC BY 4.0 license. |
Licensing
[edit]
This file is licensed under the Creative Commons Attribution 4.0 International license.
- You are free:
- to share – to copy, distribute and transmit the work
- to remix – to adapt the work
- Under the following conditions:
- attribution – You must give appropriate credit, provide a link to the license, and indicate if changes were made. You may do so in any reasonable manner, but not in any way that suggests the licensor endorses you or your use.
File history
Click on a date/time to view the file as it appeared at that time.
| Date/Time | Thumbnail | Dimensions | User | Comment | |
|---|---|---|---|---|---|
| current | 00:07, 13 August 2018 | | 1,032 × 1,387 (418 KB) | Gretarsson (talk | contribs) | larger and better resoluted file, clipped from the PDF version |
| 19:29, 11 August 2018 |  | 454 × 610 (259 KB) | Gretarsson (talk | contribs) | {{Information |description ={{en|1=Original figure caption: ''Map of the Baltic Sea showing (A) modeled mean bottom salinity in the Baltic Sea from Bendtsen et al. (2007) and the borders and names of ICES subdivisions'' [i.e. SD 23, SD24, etc.]''; deep-water basins where pelagic flounders can reproduce have a salinity above 11 psu (green color) and are indicated by arrows, and (B) the sampling locations from this study (large pie charts with black rings and bold text labels) and from Momigl... |
You cannot overwrite this file.
File usage on Commons
There are no pages that use this file.
File usage on other wikis
The following other wikis use this file:
- Usage on de.wikipedia.org