File:Bessel-butterworth-filter.svg
Jump to navigation
Jump to search

Size of this PNG preview of this SVG file: 293 × 599 pixels. Other resolutions: 117 × 240 pixels | 234 × 480 pixels | 375 × 768 pixels | 500 × 1,024 pixels | 1,001 × 2,048 pixels | 461 × 943 pixels.
Original file (SVG file, nominally 461 × 943 pixels, file size: 471 KB)
Captions
Captions
Add a one-line explanation of what this file represents
Summary
[edit]
| Description |
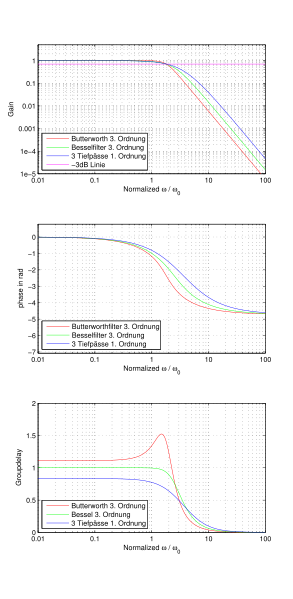
Deutsch: Besselfilter English: Comparison of a bessel filter, a Butterworth filter and 3 cascaded 1st order lowpass filters |
| Date | |
| Source |
 |
| Author | chris828 |
Licensing
[edit]
This file is licensed under the Creative Commons Attribution 3.0 Unported license.
- You are free:
- to share – to copy, distribute and transmit the work
- to remix – to adapt the work
- Under the following conditions:
- attribution – You must give appropriate credit, provide a link to the license, and indicate if changes were made. You may do so in any reasonable manner, but not in any way that suggests the licensor endorses you or your use.
Matlab Code
[edit]
%% draw the plots

% Main program to calculate group delay of a butterworth bessel
% Author: mik81@de.wikipedia.org, chris828
% bessel especially butterworth with 3rd Order

clear all;
close all;

omega = (-2.:0.01:2.);
omega = 10..^omega;
time = (0.:0.01:20.);
step = zeros(length(time),1);
for i=200:1:length(step)
  step(i) = 1;
end

%
% Functions
%

besselThirdOrder = 1 ./ ...
   ( 1 + ( omega .*  1i ) ...
      + ( omega .*  1i).^2 .* (2 ./ 5) ...
      + ( omega .*  1i).^3 .* (1 ./ 15) ...
   );
besselFourthOrder = 1 ./ ...
  ( 1 + ( omega .* 1i ) ...
    + ( omega .* 1i).^2 .* (3 ./ 7) ...
    + ( omega .* 1i).^3 .* (2 ./ 21) ...
    + ( omega .* 1i).^4 .* (1 ./ 105) ...
  );
besselFifthOrder = 1 ./ ...
  ( 1 + ( omega .* 1i ) ...
    + ( omega .* 1i ).^2 .* (4 ./ 9) ...
    + ( omega .* 1i ).^3 .* (1 ./ 9) ...
    + ( omega .* 1i ).^4 .* (1 ./ 63) ...
    + ( omega .* 1i ).^5 .* (1 ./ 945) ...
  );

butterworthThirdOrder = 1 ./ ...
   ( (1 + (omega .* (1/1.8) .* 1i)) ...
     .* ( 1 + (omega .* (1/1.8) .* 1i) + (omega .* (1/1.8) .* 1i).^2 ));
% butterworthThirdOrderIIR_y_a = 1 ./ (1+ y_a_1 )
% butterworthThirdOrderIIR_y_b = ( 1 ./ ( 1 + y_b_1 + y_b_2^2 ))
threeFilterFirstOrder = 1 ./ ...
  ( (1 + ( 1/3.6 .* omega .* 1i)) ...
     .* (1 + ( 1/3.6 .* omega .* 1i)) ...
     .* (1 + ( 1/3.6 .* omega .* 1i)) ...
  );

%
% Calculate and plot gain
%
f1 = figure;
subplot(3,1,1);
loglog( ...
    omega, abs(butterworthThirdOrder), 'r' ...
   , omega, abs(besselThirdOrder), 'g' ...
  , omega, abs(threeFilterFirstOrder), 'b' ...
   , [0.01, 100.], [1/sqrt(2), 1/sqrt(2)], 'm');
axis ([0.01, 100., 0.00001, 5.]);
legend('Butterworth 3. Ordnung',   'Besselfilter 3. Ordnung',  '3 Tiefpässe 1. Ordnung' , '-3dB Linie', 'Location', 'SouthWest');
set(gca, 'xtick', [0.01 0.1 1 10 100]);
set(gca, 'xticklabel', {'0.01', '0.1', '1', '10', '100'});
set(gca, 'ytick', [1e-5 1e-4 0.001 0.01 0.1 1]);
set(gca, 'yticklabel', {'1e-5', '1e-4', '0.001', '0.01', '0.1', '1'});
grid ('on');
xlabel('Normalized \omega / \omega_0');
ylabel('Gain');
%orient('landscape');
%print ('butterworthFrequency.png', '-dpng', '-landscape');
%print ('butterworthFrequency.svg', '-dsvg', '-landscape');
%print(f1, '-dpng', 'butterworthFrequency.png');
%print(f1, '-depsc2', 'butterworthFrequency.eps');
%
% Calculate and plot phase
%

% Butterworth
butterworthThirdOrderAngle = angle(butterworthThirdOrder);
% correct roll over of phase
shift = 0;
lastAngle = butterworthThirdOrderAngle(1);

for i=2:1:length(butterworthThirdOrderAngle)
  if ( lastAngle < 0 && butterworthThirdOrderAngle(i) > 0)
    shift = shift - 2*pi;
  end
  lastAngle = butterworthThirdOrderAngle(i);
  butterworthThirdOrderAngle(i) = butterworthThirdOrderAngle(i) + shift;
end

% Bessel

besselThirdOrderAngle = angle(besselThirdOrder);

% correct roll over of phase
shift = 0;
lastAngle = besselThirdOrderAngle(1);
for i=2:1:length(besselThirdOrderAngle)
  if ( lastAngle < 0 && besselThirdOrderAngle(i) > 0)
    shift = shift - 2*pi;
  end
  lastAngle = besselThirdOrderAngle(i);
  besselThirdOrderAngle(i) = besselThirdOrderAngle(i) + shift;
end
besselFourthOrderAngle = angle(besselFourthOrder);
% correct roll over of phase
shift = 0;
lastAngle = besselFourthOrderAngle(1);

for i=2:1:length(besselFourthOrderAngle)
  if ( lastAngle < 0 && besselFourthOrderAngle(i) > 0)
    shift = shift - 2*pi;
  end
  lastAngle = besselFourthOrderAngle(i);
  besselFourthOrderAngle(i) = besselFourthOrderAngle(i) + shift;
end

% three filter first order

threeFilterFirstOrderAngle = angle(threeFilterFirstOrder);

% correct roll over of phase
shift = 0;
lastAngle = threeFilterFirstOrderAngle(1);
for i=2:1:length(threeFilterFirstOrderAngle)
  if ( lastAngle < 0 && threeFilterFirstOrderAngle(i) > 0)
    shift = shift - 2*pi;
  end
  lastAngle = threeFilterFirstOrderAngle(i);
  threeFilterFirstOrderAngle(i) = threeFilterFirstOrderAngle(i) + shift;
end

subplot(3,1,2);
semilogx( ...
   omega, butterworthThirdOrderAngle, 'r'...
   , omega, besselThirdOrderAngle, 'g'...
   , omega, threeFilterFirstOrderAngle, 'b');
legend('Butterworthfilter 3. Ordnung', 'Besselfilter 3. Ordnung', '3 Tiefpässe 1. Ordnung', 'Location', 'SouthWest');
axis ([0.01, 100., -pi*9/4, pi/4]);
set(gca, 'xtick', [0.01 0.1 1 10 100]);
set(gca, 'xticklabel', {'0.01', '0.1', '1', '10', '100'});
grid ('on');
xlabel('Normalized \omega / \omega_0');
ylabel('phase in rad');
%
% Calculate and plot group delay with phase
%

%  -deltaAngle/deltaOmega

% butterworth
lastAngle = butterworthThirdOrderAngle(1);
lastOmega = omega(1);
butterworthThirdOrderGroupDelay = zeros(length(butterworthThirdOrder),1);
for i=2:1:length(butterworthThirdOrderAngle)
  butterworthThirdOrderGroupDelay(i) = ...
     -1. * (butterworthThirdOrderAngle(i)-lastAngle)/(omega(i)-lastOmega);
  lastOmega = omega(i);
  lastAngle = butterworthThirdOrderAngle(i);
end
butterworthThirdOrderGroupDelay(1) = butterworthThirdOrderGroupDelay(2);

% bessel
lastAngle = besselThirdOrderAngle(1);
lastOmega = omega(1);
besselThirdOrderGroupDelay = zeros(length(besselThirdOrder),1);
for i=2:1:length(besselThirdOrderAngle)
  besselThirdOrderGroupDelay(i) = ...
     -1. * (besselThirdOrderAngle(i)-lastAngle)/(omega(i)-lastOmega);
  lastOmega = omega(i);
  lastAngle = besselThirdOrderAngle(i);
end
besselThirdOrderGroupDelay(1) = besselThirdOrderGroupDelay(2);

lastAngle = besselFourthOrderAngle(1);
lastOmega = omega(1);
besselFourthOrderGroupDelay = zeros(length(besselFourthOrder),1);
for i=2:1:length(besselFourthOrderAngle)
  besselFourthOrderGroupDelay(i) = ...
     -1. * (besselFourthOrderAngle(i)-lastAngle)/(omega(i)-lastOmega);
  lastOmega = omega(i);
  lastAngle = besselFourthOrderAngle(i);
end
besselFourthOrderGroupDelay(1) = besselFourthOrderGroupDelay(2);

% three first order
lastAngle = threeFilterFirstOrderAngle(1);
lastOmega = omega(1);
threeFilterFirstOrderGroupDelay = zeros(length(threeFilterFirstOrder),1);
for i=2:1:length(threeFilterFirstOrderAngle)
  threeFilterFirstOrderGroupDelay(i) = ...
     -1. * (threeFilterFirstOrderAngle(i)-lastAngle)/(omega(i)-lastOmega);
  lastOmega = omega(i);
  lastAngle = threeFilterFirstOrderAngle(i);
end
threeFilterFirstOrderGroupDelay(1) = threeFilterFirstOrderGroupDelay(2);

subplot(3,1,3);
semilogx( ...
    omega, butterworthThirdOrderGroupDelay, 'r'...
   , omega, besselThirdOrderGroupDelay, 'g'...
  , omega, threeFilterFirstOrderGroupDelay, 'b');
axis ('auto');
grid ('on');
xlabel('Normalized \omega / \omega_0');
ylabel('Groupdelay');
legend('Butterworth 3. Ordnung', 'Bessel 3. Ordnung', '3 Tiefpässe 1. Ordnung', 'Location', 'SouthWest');
set(gca, 'xtick', [0.01 0.1 1 10 100]);
set(gca, 'xticklabel', {'0.01', '0.1', '1', '10', '100'});

%% save plots
print(f1, '-dpng', 'butterworth.png');
print(f1, '-depsc', 'butterworth.eps');
File history
Click on a date/time to view the file as it appeared at that time.
| Date/Time | Thumbnail | Dimensions | User | Comment | |
|---|---|---|---|---|---|
| current | 18:03, 4 April 2015 | | 461 × 943 (471 KB) | Chris828 (talk | contribs) | text as path |
| 17:58, 4 April 2015 |  | 461 × 943 (273 KB) | Chris828 (talk | contribs) | User created page with UploadWizard |
You cannot overwrite this file.
File usage on Commons
The following page uses this file:
File usage on other wikis
The following other wikis use this file:
- Usage on de.wikipedia.org