File:Beta distribution pdf.svg
Siirry navigaatioon
Siirry hakuun

Tämän PNG-esikatselun koko koskien SVG-tiedostoa: 531 × 425 kuvapistettä. Muut resoluutiot: 300 × 240 kuvapistettä | 600 × 480 kuvapistettä | 960 × 768 kuvapistettä | 1 280 × 1 024 kuvapistettä | 2 559 × 2 048 kuvapistettä.
Alkuperäinen tiedosto (SVG-tiedosto; oletustarkkuus 531 × 425 kuvapistettä; tiedostokoko 80 KiB)
Kuvatekstit
Kuvatekstit
Lisää yhden rivin pituinen kuvaus tästä tiedostosta
Yhteenveto[muokkaa]
| Kuvaus |
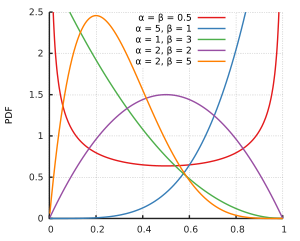
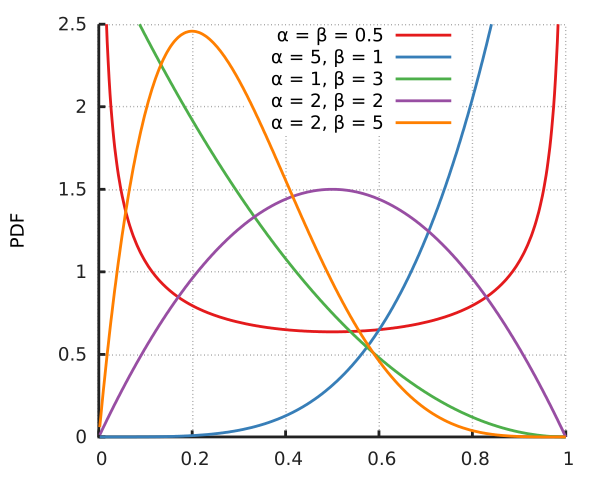
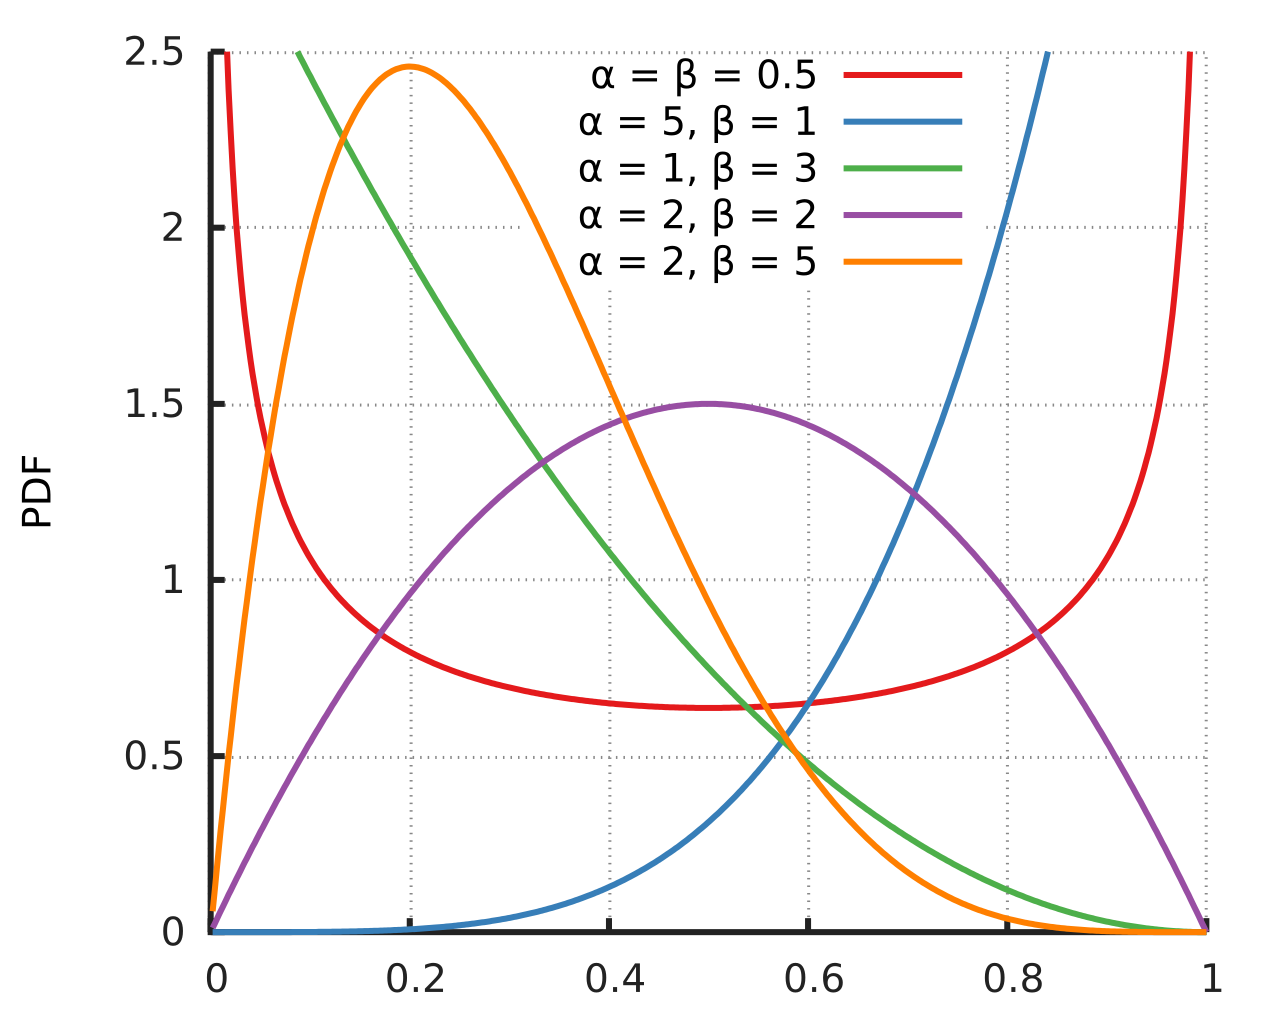
English: Probability density function for the Beta distribution. Created using Gnuplot. |
||||
| Päiväys | |||||
| Lähde | Oma teos | ||||
| Tekijä | Horas based on the work of Krishnavedala | ||||
| Muut versiot | File:Beta_distribution_pdf.png | ||||
| SVG kehittely | |||||
| Lähdekoodi | Gnuplot code
Data
|
Lisenssi[muokkaa]
| Tämä tiedosto ei ylitä teoskynnystä, joten se ei saa tekijänoikeuden suojaa. |
Tiedoston historia
Päiväystä napsauttamalla näet, millainen tiedosto oli kyseisellä hetkellä.
| Päiväys | Pienoiskuva | Koko | Käyttäjä | Kommentti | |
|---|---|---|---|---|---|
| nykyinen | 14. marraskuuta 2014 kello 13.10 | | 531 × 425 (80 KiB) | Horas (keskustelu | muokkaukset) | {{Information |Description={{en|1=Probability density function for the Beta distribution. Created using the following code: reset reset session out=2 outputpath= "./" outputfilename="betadistribution" if(out==1) {... |
| 4. kesäkuuta 2011 kello 21.45 |  | 639 × 489 (68 KiB) | Krishnavedala (keskustelu | muokkaukset) | {{Information |Description ={{en|1=Probability density function for the Beta distribution. Created using python with matplotlib, scipy and numpy toolboxes. <syntaxhighlight lang=" |
Et voi tallentaa uutta tiedostoa tämän tilalle.
Tiedoston käyttö
Seuraava sivu käyttää tätä tiedostoa:
Tiedoston järjestelmänlaajuinen käyttö
Seuraavat muut wikit käyttävät tätä tiedostoa:
- Käyttö kohteessa be.wikipedia.org
- Käyttö kohteessa ca.wikipedia.org
- Käyttö kohteessa de.wikipedia.org
- Käyttö kohteessa en.wikipedia.org
- Käyttö kohteessa en.wikibooks.org
- Käyttö kohteessa en.wiktionary.org
- Käyttö kohteessa fi.wikipedia.org
- Käyttö kohteessa he.wikipedia.org
- Käyttö kohteessa it.wikipedia.org
- Käyttö kohteessa ja.wikipedia.org
- Käyttö kohteessa ko.wikipedia.org
- Käyttö kohteessa pt.wikipedia.org
- Käyttö kohteessa tl.wikipedia.org
- Käyttö kohteessa tr.wikipedia.org
- Käyttö kohteessa uk.wikipedia.org
- Käyttö kohteessa zh.wikipedia.org