File:Bistability graph.svg
Jump to navigation
Jump to search

Size of this PNG preview of this SVG file: 541 × 392 pixels. Other resolutions: 320 × 232 pixels | 640 × 464 pixels | 1,024 × 742 pixels | 1,280 × 927 pixels | 2,560 × 1,855 pixels.
Original file (SVG file, nominally 541 × 392 pixels, file size: 12 KB)
Captions
Captions
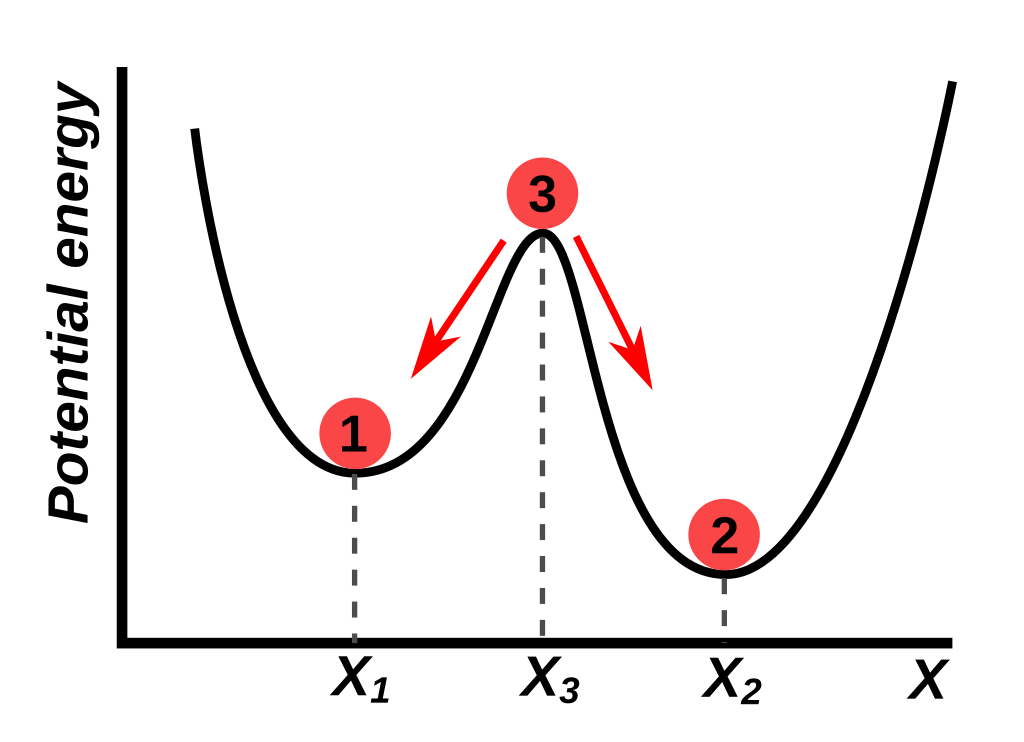
Graph of the potential energy of a bistable system
Summary
[edit]
| Description |
English: Graph of the potential energy of a conservative bistable system. There are two local minima of the potential energy at x1 and x2 which are stable equilibrium points at which the red object can rest. Between them is a local maximum of energy x3 which is an unstable equilibrium point. If the red object is placed there it is in equilibrium but unstable; the slightest disturbance will cause it to move to one of the stable equilibrium points |
| Date | |
| Source | Own work |
| Author | Chetvorno |
Licensing
[edit]
I, the copyright holder of this work, hereby publish it under the following license:
| This file is made available under the Creative Commons CC0 1.0 Universal Public Domain Dedication. | |
| The person who associated a work with this deed has dedicated the work to the public domain by waiving all of their rights to the work worldwide under copyright law, including all related and neighboring rights, to the extent allowed by law. You can copy, modify, distribute and perform the work, even for commercial purposes, all without asking permission.
|
File history
Click on a date/time to view the file as it appeared at that time.
| Date/Time | Thumbnail | Dimensions | User | Comment | |
|---|---|---|---|---|---|
| current | 19:51, 9 December 2019 | | 541 × 392 (12 KB) | Chetvorno (talk | contribs) | User created page with UploadWizard |
You cannot overwrite this file.
File usage on Commons
There are no pages that use this file.
File usage on other wikis
The following other wikis use this file:
- Usage on ar.wikipedia.org
- Usage on en.wikipedia.org
- Usage on ja.wikipedia.org