File:Ch4 gr gl.png
跳至導覽
跳至搜尋
預覽大小:800 × 480 像素。 其他解析度:320 × 192 像素。
原始檔案 (1,000 × 600 像素,檔案大小:29 KB,MIME 類型:image/png)
說明
說明
添加單行說明來描述出檔案所代表的內容
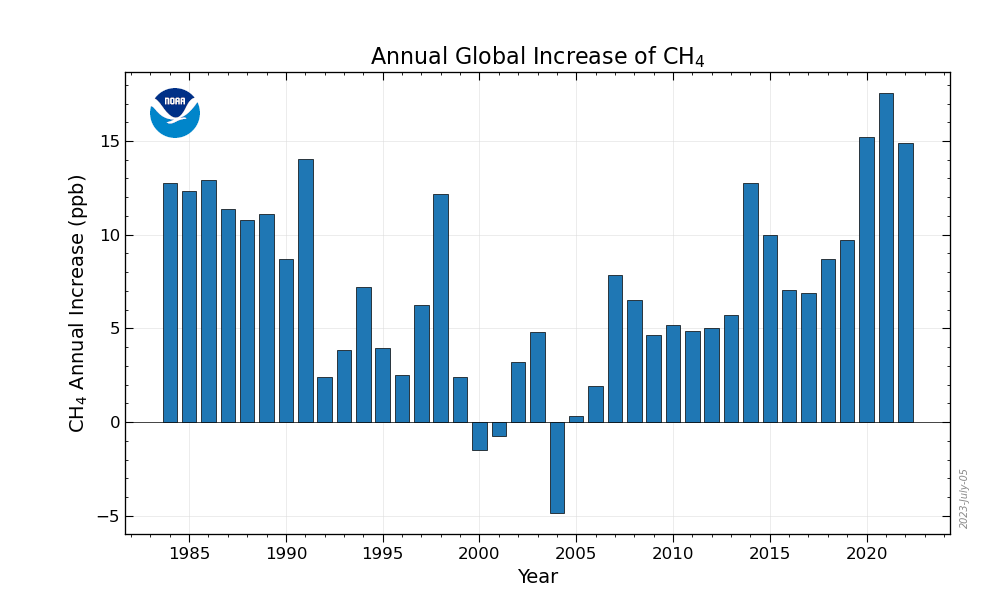
Annual Increase in Globally-Averaged Atmospheric Methane
摘要
[編輯]
| 描述 |
English: The annual increase in atmospheric CH4 in a given year is the increase in its abundance (mole fraction) from January 1 in that year to January 1 of the next year, after the seasonal cycle has been removed (as shown by the black lines in the figure above). It represents the sum of all CH4 added to, and removed from, the atmosphere during the year by human activities and natural processes. |
| 日期 | |
| 來源 |
https://gml.noaa.gov/ccgg/trends_ch4/ Lan, X., K.W. Thoning, and E.J. Dlugokencky: Trends in globally-averaged CH4, N2O, and SF6 determined from NOAA Global Monitoring Laboratory measurements. Version 2022-11, https://doi.org/10.15138/P8XG-AA10 |
| 作者 | NOAA Global Monitoring Laboratory |
授權條款
[編輯]
本圖像屬於公有領域,因該作品最初來自於美國國家海洋和大氣管理局職員的職務作品。
|
檔案歷史
點選日期/時間以檢視該時間的檔案版本。
| 日期/時間 | 縮圖 | 尺寸 | 使用者 | 備註 | |
|---|---|---|---|---|---|
| 目前 | 2023年7月6日 (四) 01:40 | | 1,000 × 600(29 KB) | Renerpho(留言 | 貢獻) | Update, version 2023-07-05 |
| 2022年11月7日 (一) 22:03 |  | 1,000 × 600(29 KB) | Renerpho(留言 | 貢獻) | Uploaded a work by NOAA Global Monitoring Laboratory from https://gml.noaa.gov/ccgg/trends_ch4/ Lan, X., K.W. Thoning, and E.J. Dlugokencky: Trends in globally-averaged CH4, N2O, and SF6 determined from NOAA Global Monitoring Laboratory measurements. Version 2022-11, https://doi.org/10.15138/P8XG-AA10 with UploadWizard |
無法覆蓋此檔案。
檔案用途
沒有使用此檔案的頁面。
全域檔案使用狀況
以下其他 wiki 使用了這個檔案:
- en.wikipedia.org 的使用狀況
- fr.wikipedia.org 的使用狀況
- zh.wikipedia.org 的使用狀況