File:Co2-temperature-plot.png

Original file (1,469 × 1,016 pixels, file size: 111 KB, MIME type: image/png)
Captions
Captions
Summary[edit]
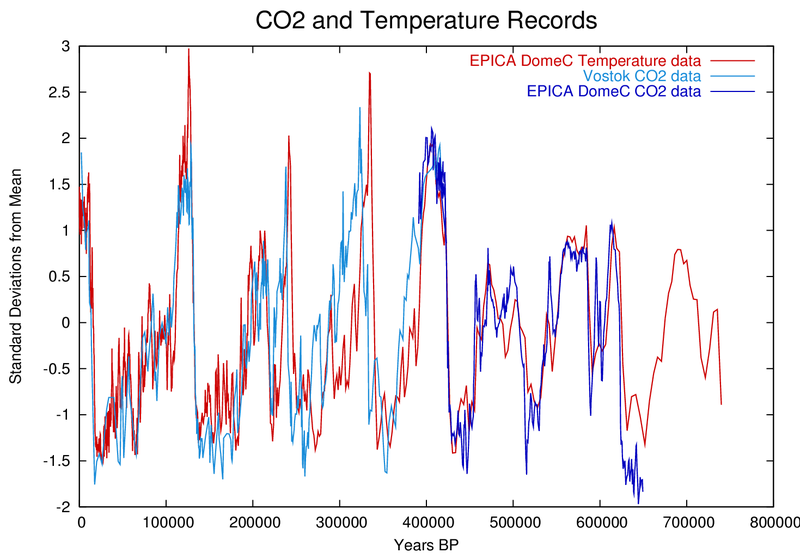
From en Wikipedia, Ice age, glacialogy, paleoclimatology
Licensing[edit]
| This file is licensed under the Creative Commons Attribution-Share Alike 3.0 Unported license. Subject to disclaimers. | ||
| ||
| This licensing tag was added to this file as part of the GFDL licensing update. |

|
Permission is granted to copy, distribute and/or modify this document under the terms of the GNU Free Documentation License, Version 1.2 or any later version published by the Free Software Foundation; with no Invariant Sections, no Front-Cover Texts, and no Back-Cover Texts. A copy of the license is included in the section entitled GNU Free Documentation License. Subject to disclaimers. |
deutsch: Daten über die Grafik liegen unter http://www.ncdc.noaa.gov/paleo/icecore/antarctica/domec/domec_epica_data.html vor und sind frei downloadbar. Die CO2- Konzentration folgt der Erwärmung um ca. 500 Jahre nach. Ob die Dauer des CO2- Einschlusses, welche mit mehreren Hundert Jahren bis mehreren Jahrtausenden vermutet wird, in diesen Daten bereits enthalten ist, geht aus dem link und den readme der Exceltabellen nicht hervor.
english: Data about this diagram are stored at http://www.ncdc.noaa.gov/paleo/icecore/antarctica/domec/domec_epica_data.html and are freely downloadable. The CO2 concentration is following the warming with about 500 years delay. If the duration of the CO2 encapsulation - supposed to be some hundred to several thousands of years - is already included in that data will not resolve from the link and the readme of the Excel tables.
File history
Click on a date/time to view the file as it appeared at that time.
| Date/Time | Thumbnail | Dimensions | User | Comment | |
|---|---|---|---|---|---|
| current | 21:08, 10 February 2006 | | 1,469 × 1,016 (111 KB) | Merikanto~commonswiki (talk | contribs) | From en Wikipedia, Ice age, glacialogy, paleoclimatology |
You cannot overwrite this file.
File usage on Commons
The following page uses this file:
File usage on other wikis
The following other wikis use this file:
- Usage on ca.wikipedia.org
- Usage on en.wikipedia.org
- Usage on he.wikipedia.org