File:Comp-Comp-Poisson-Pro.png

Original file (1,600 × 1,200 pixels, file size: 13 KB, MIME type: image/png)
Captions
Captions
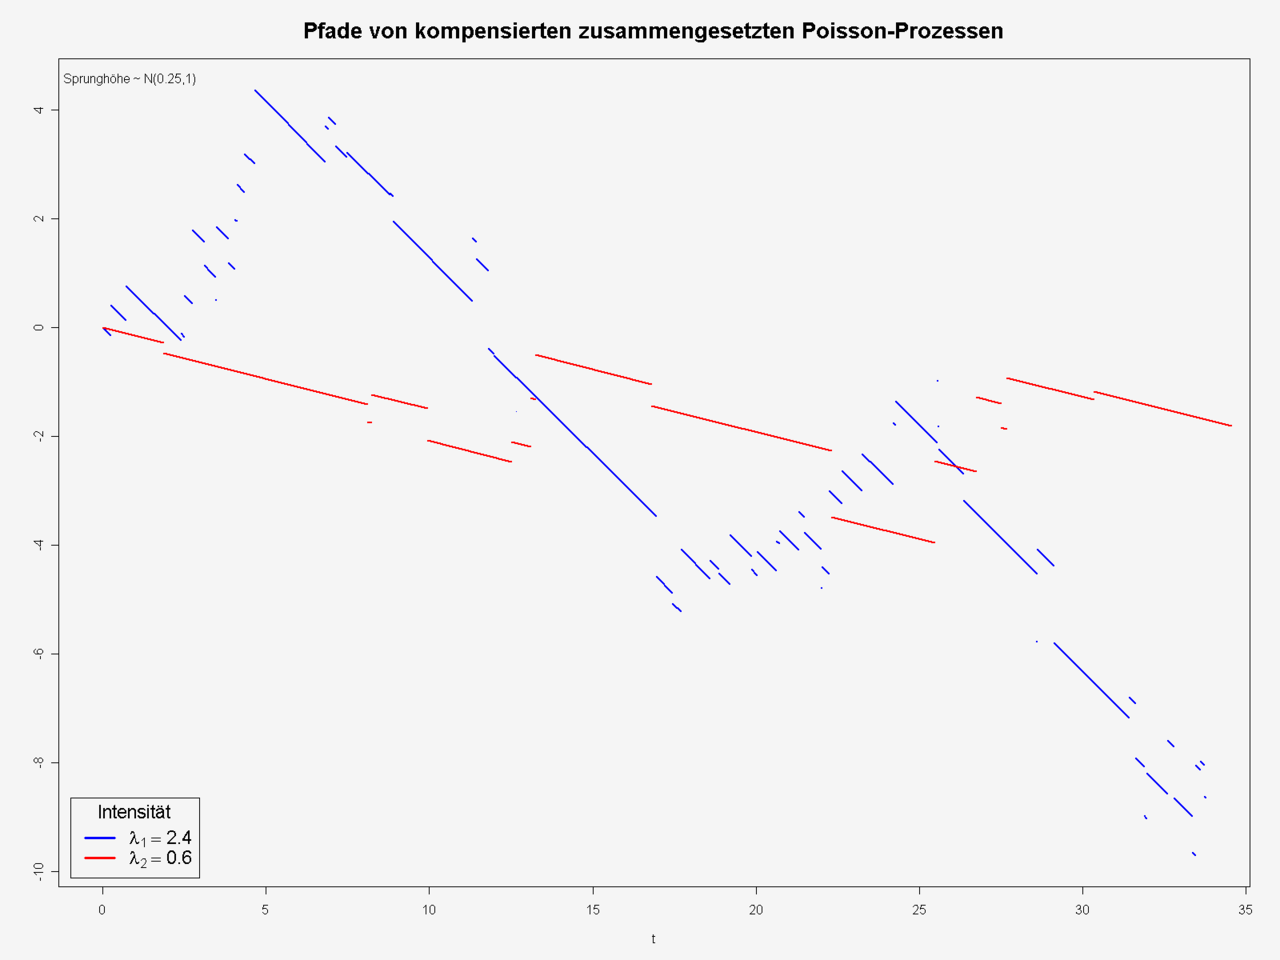
| Description | two trajectories of compound (normal) compensated poisson processes. intensities: 2.4 and 0.6, normal distr.: N(0.25,1) |
| Date | |
| Source | plot by GNU R, see source below. |
| Author | Thomas Steiner |
| Permission (Reusing this file) |
Thomas Steiner put it under the GFDL |
de: Pfade von zwei kompensierten zusammengesetzten Poisson-Prozessen. Wie in de:Poissonprozess.png ist die Intensität (Sprunghäufigkeit) des blauen Prozesses mit 2,4 genau viermal so hoch wie die des roten Prozesses. Im gezeichneten Intervall [0,35] springt der blaue Prozess 66-mal, der rote 16-mal, also etwa viermal so oft. Bei beiden Prozessen sind die Sprünge normalverteilt mit Mittel 0,25. Diese Sprünge nach oben werden durch den negativen Drift genau so ausgeglichen (kompensiert), dass beide Prozesse Martingale sind. Da der blaue Prozess öfter nach oben springt, ist sein negativer "Drift" stärker.

|
Permission is granted to copy, distribute and/or modify this document under the terms of the GNU Free Documentation License, Version 1.2 or any later version published by the Free Software Foundation; with no Invariant Sections, no Front-Cover Texts, and no Back-Cover Texts. A copy of the license is included in the section entitled GNU Free Documentation License. |
| This file is licensed under the Creative Commons Attribution-Share Alike 3.0 Unported license. | ||
| ||
| This licensing tag was added to this file as part of the GFDL licensing update. |
R source code:
set.seed(29011980)

##plots a compound (normal), compensated poisson process.
poisson.process<-function(lambda, T, mu, sigma, drift=-lambda*mu) {
  N=rpois(n=1, lambda=lambda*T)                                   #number of jumps
  t=sort(array(data=runif(n=N, min=0,max=T),dim=N))               #jump times
  y=array(data=rnorm(n=N,mean=mu,sd=sigma), dim=N)                #jump sizes
  t=t-t[1]
  s=array(NA, dim=2*N)
  s[2*(1:N)-1]=diff(c(t,T))*drift
  s[2*(1:N)]  =y
  s=c(0,cumsum(s))
  ti=seq(from=1, to=N)
  return(list(s=s,t=t,ti=ti))
}

pp1=poisson.process(lambda=2.4,T=35,mu=0.25,sigma=1)
pp2=poisson.process(lambda=0.6,T=35,mu=0.25,sigma=1)

png(filename="Comp-Comp-Poisson-Pro.png", width=1600, height=1200, pointsize=12)
par(bg="whitesmoke")
plot(c(0,pp1$t),c(0,pp1$t),type="n",xlab="t",ylab="",ylim=range(pp1$s,pp2$s))
segments(pp1$t[pp1$ti], pp1$s[2*pp1$ti-1], pp1$t[pp1$ti+1], pp1$s[2*pp1$ti], col="blue", lwd=2)
segments(pp2$t[pp2$ti], pp2$s[2*pp2$ti-1], pp2$t[pp2$ti+1], pp2$s[2*pp2$ti], col="red", lwd=2)

title(main="Pfade von kompensierten zusammengesetzten Poisson-Prozessen",cex.main=1.7)
legend(x="bottomleft", inset=0.01, cex=1.4, title="Intensität", legend=c(expression(lambda[1]==2.4,lambda[2]==0.6)), col=c("blue","red"), lwd=3)
text(x=par("usr")[1]*0.9, y=par("usr")[4]*0.95, labels="Sprunghöhe ~ N(0.25,1)", adj=c(0,1))
dev.off()
File history
Click on a date/time to view the file as it appeared at that time.
| Date/Time | Thumbnail | Dimensions | User | Comment | |
|---|---|---|---|---|---|
| current | 07:41, 24 August 2006 | | 1,600 × 1,200 (13 KB) | Thire (talk | contribs) | {{Information| |Description = two trajectories of compound (normal) compensated poisson processes. intensities: 2.4 and 0.6, normal distr.: N(0.25,1) |Source = plot by GNU R, see source below. |Date = 24 aug 2006 |Author = [[:de:Benutzer:Thire|Thomas Stei |
You cannot overwrite this file.
File usage on Commons
There are no pages that use this file.
File usage on other wikis
The following other wikis use this file:
- Usage on de.wikipedia.org
- Usage on de.wikibooks.org
- Usage on zh.wikipedia.org