File:Comp-Comp-Poisson-Pro.png
跳转到导航
跳转到搜索

本预览的尺寸:800 × 600像素。 其他分辨率:320 × 240像素 | 640 × 480像素 | 1,024 × 768像素 | 1,280 × 960像素 | 1,600 × 1,200像素。
原始文件 (1,600 × 1,200像素,文件大小:13 KB,MIME类型:image/png)
说明
说明
添加一行文字以描述该文件所表现的内容
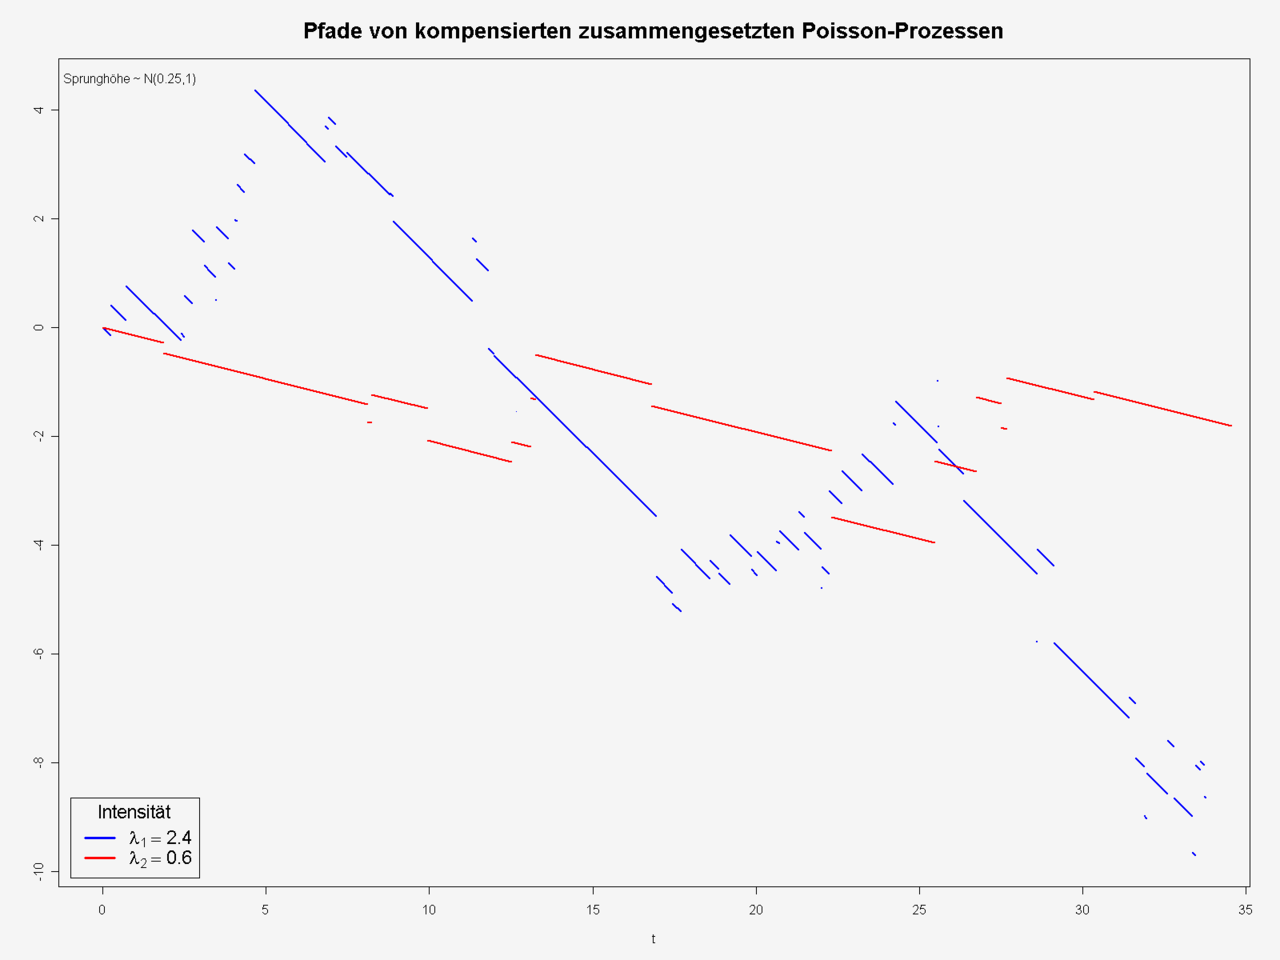
| 描述 | two trajectories of compound (normal) compensated poisson processes. intensities: 2.4 and 0.6, normal distr.: N(0.25,1) |
| 日期 | |
| 来源 | plot by GNU R, see source below. |
| 作者 | Thomas Steiner |
| 授权 (二次使用本文件) |
Thomas Steiner put it under the GFDL |
de: Pfade von zwei kompensierten zusammengesetzten Poisson-Prozessen. Wie in de:Poissonprozess.png ist die Intensität (Sprunghäufigkeit) des blauen Prozesses mit 2,4 genau viermal so hoch wie die des roten Prozesses. Im gezeichneten Intervall [0,35] springt der blaue Prozess 66-mal, der rote 16-mal, also etwa viermal so oft. Bei beiden Prozessen sind die Sprünge normalverteilt mit Mittel 0,25. Diese Sprünge nach oben werden durch den negativen Drift genau so ausgeglichen (kompensiert), dass beide Prozesse Martingale sind. Da der blaue Prozess öfter nach oben springt, ist sein negativer "Drift" stärker.

|
已授权您依据自由软件基金会发行的无固定段落及封面封底文字(Invariant Sections, Front-Cover Texts, and Back-Cover Texts)的GNU自由文件许可协议1.2版或任意后续版本的条款,复制、传播和/或修改本文件。该协议的副本请见“GNU Free Documentation License”。 |
| 本文件采用知识共享署名-相同方式共享 3.0 未本地化版本许可协议授权。 | ||
| ||
| 本许可协议标签作为GFDL许可协议更新的组成部分被添加至本文件。 |
R source code:
set.seed(29011980)

##plots a compound (normal), compensated poisson process.
poisson.process<-function(lambda, T, mu, sigma, drift=-lambda*mu) {
  N=rpois(n=1, lambda=lambda*T)                                   #number of jumps
  t=sort(array(data=runif(n=N, min=0,max=T),dim=N))               #jump times
  y=array(data=rnorm(n=N,mean=mu,sd=sigma), dim=N)                #jump sizes
  t=t-t[1]
  s=array(NA, dim=2*N)
  s[2*(1:N)-1]=diff(c(t,T))*drift
  s[2*(1:N)]  =y
  s=c(0,cumsum(s))
  ti=seq(from=1, to=N)
  return(list(s=s,t=t,ti=ti))
}

pp1=poisson.process(lambda=2.4,T=35,mu=0.25,sigma=1)
pp2=poisson.process(lambda=0.6,T=35,mu=0.25,sigma=1)

png(filename="Comp-Comp-Poisson-Pro.png", width=1600, height=1200, pointsize=12)
par(bg="whitesmoke")
plot(c(0,pp1$t),c(0,pp1$t),type="n",xlab="t",ylab="",ylim=range(pp1$s,pp2$s))
segments(pp1$t[pp1$ti], pp1$s[2*pp1$ti-1], pp1$t[pp1$ti+1], pp1$s[2*pp1$ti], col="blue", lwd=2)
segments(pp2$t[pp2$ti], pp2$s[2*pp2$ti-1], pp2$t[pp2$ti+1], pp2$s[2*pp2$ti], col="red", lwd=2)

title(main="Pfade von kompensierten zusammengesetzten Poisson-Prozessen",cex.main=1.7)
legend(x="bottomleft", inset=0.01, cex=1.4, title="Intensität", legend=c(expression(lambda[1]==2.4,lambda[2]==0.6)), col=c("blue","red"), lwd=3)
text(x=par("usr")[1]*0.9, y=par("usr")[4]*0.95, labels="Sprunghöhe ~ N(0.25,1)", adj=c(0,1))
dev.off()
文件历史
点击某个日期/时间查看对应时刻的文件。
| 日期/时间 | 缩略图 | 大小 | 用户 | 备注 | |
|---|---|---|---|---|---|
| 当前 | 2006年8月24日 (四) 07:41 | | 1,600 × 1,200(13 KB) | Thire(留言 | 贡献) | {{Information| |Description = two trajectories of compound (normal) compensated poisson processes. intensities: 2.4 and 0.6, normal distr.: N(0.25,1) |Source = plot by GNU R, see source below. |Date = 24 aug 2006 |Author = [[:de:Benutzer:Thire|Thomas Stei |
您不可以覆盖此文件。
文件用途
没有页面使用本文件。
全域文件用途
以下其他wiki使用此文件:
- de.wikipedia.org上的用途
- de.wikibooks.org上的用途
- zh.wikipedia.org上的用途