File:Discontinuity jump.eps.png
پرش به ناوبری
پرش به جستجو
اندازهٔ این پیشنمایش: ۶۴۳ × ۵۹۹ پیکسل. کیفیتهای دیگر: ۲۵۸ × ۲۴۰ پیکسل | ۵۱۵ × ۴۸۰ پیکسل | ۸۲۴ × ۷۶۸ پیکسل | ۱٬۰۹۹ × ۱٬۰۲۴ پیکسل | ۲٬۱۲۲ × ۱٬۹۷۸ پیکسل.
پروندهٔ اصلی (۲٬۱۲۲ × ۱٬۹۷۸ پیکسل، اندازهٔ پرونده: ۸۱ کیلوبایت، نوع MIME پرونده: image/png)
گزینهها
عنوان
شرحی یکخطی از محتوای این فایل اضافه کنید
Transferred from en.wikipedia to Commons by Maksim.
صفحهٔ اصلی توضیحات اینجابود. همهٔ نامهای کاربر زیر به en.wikipedia اشاره دارند.
خلاصه
[ویرایش]
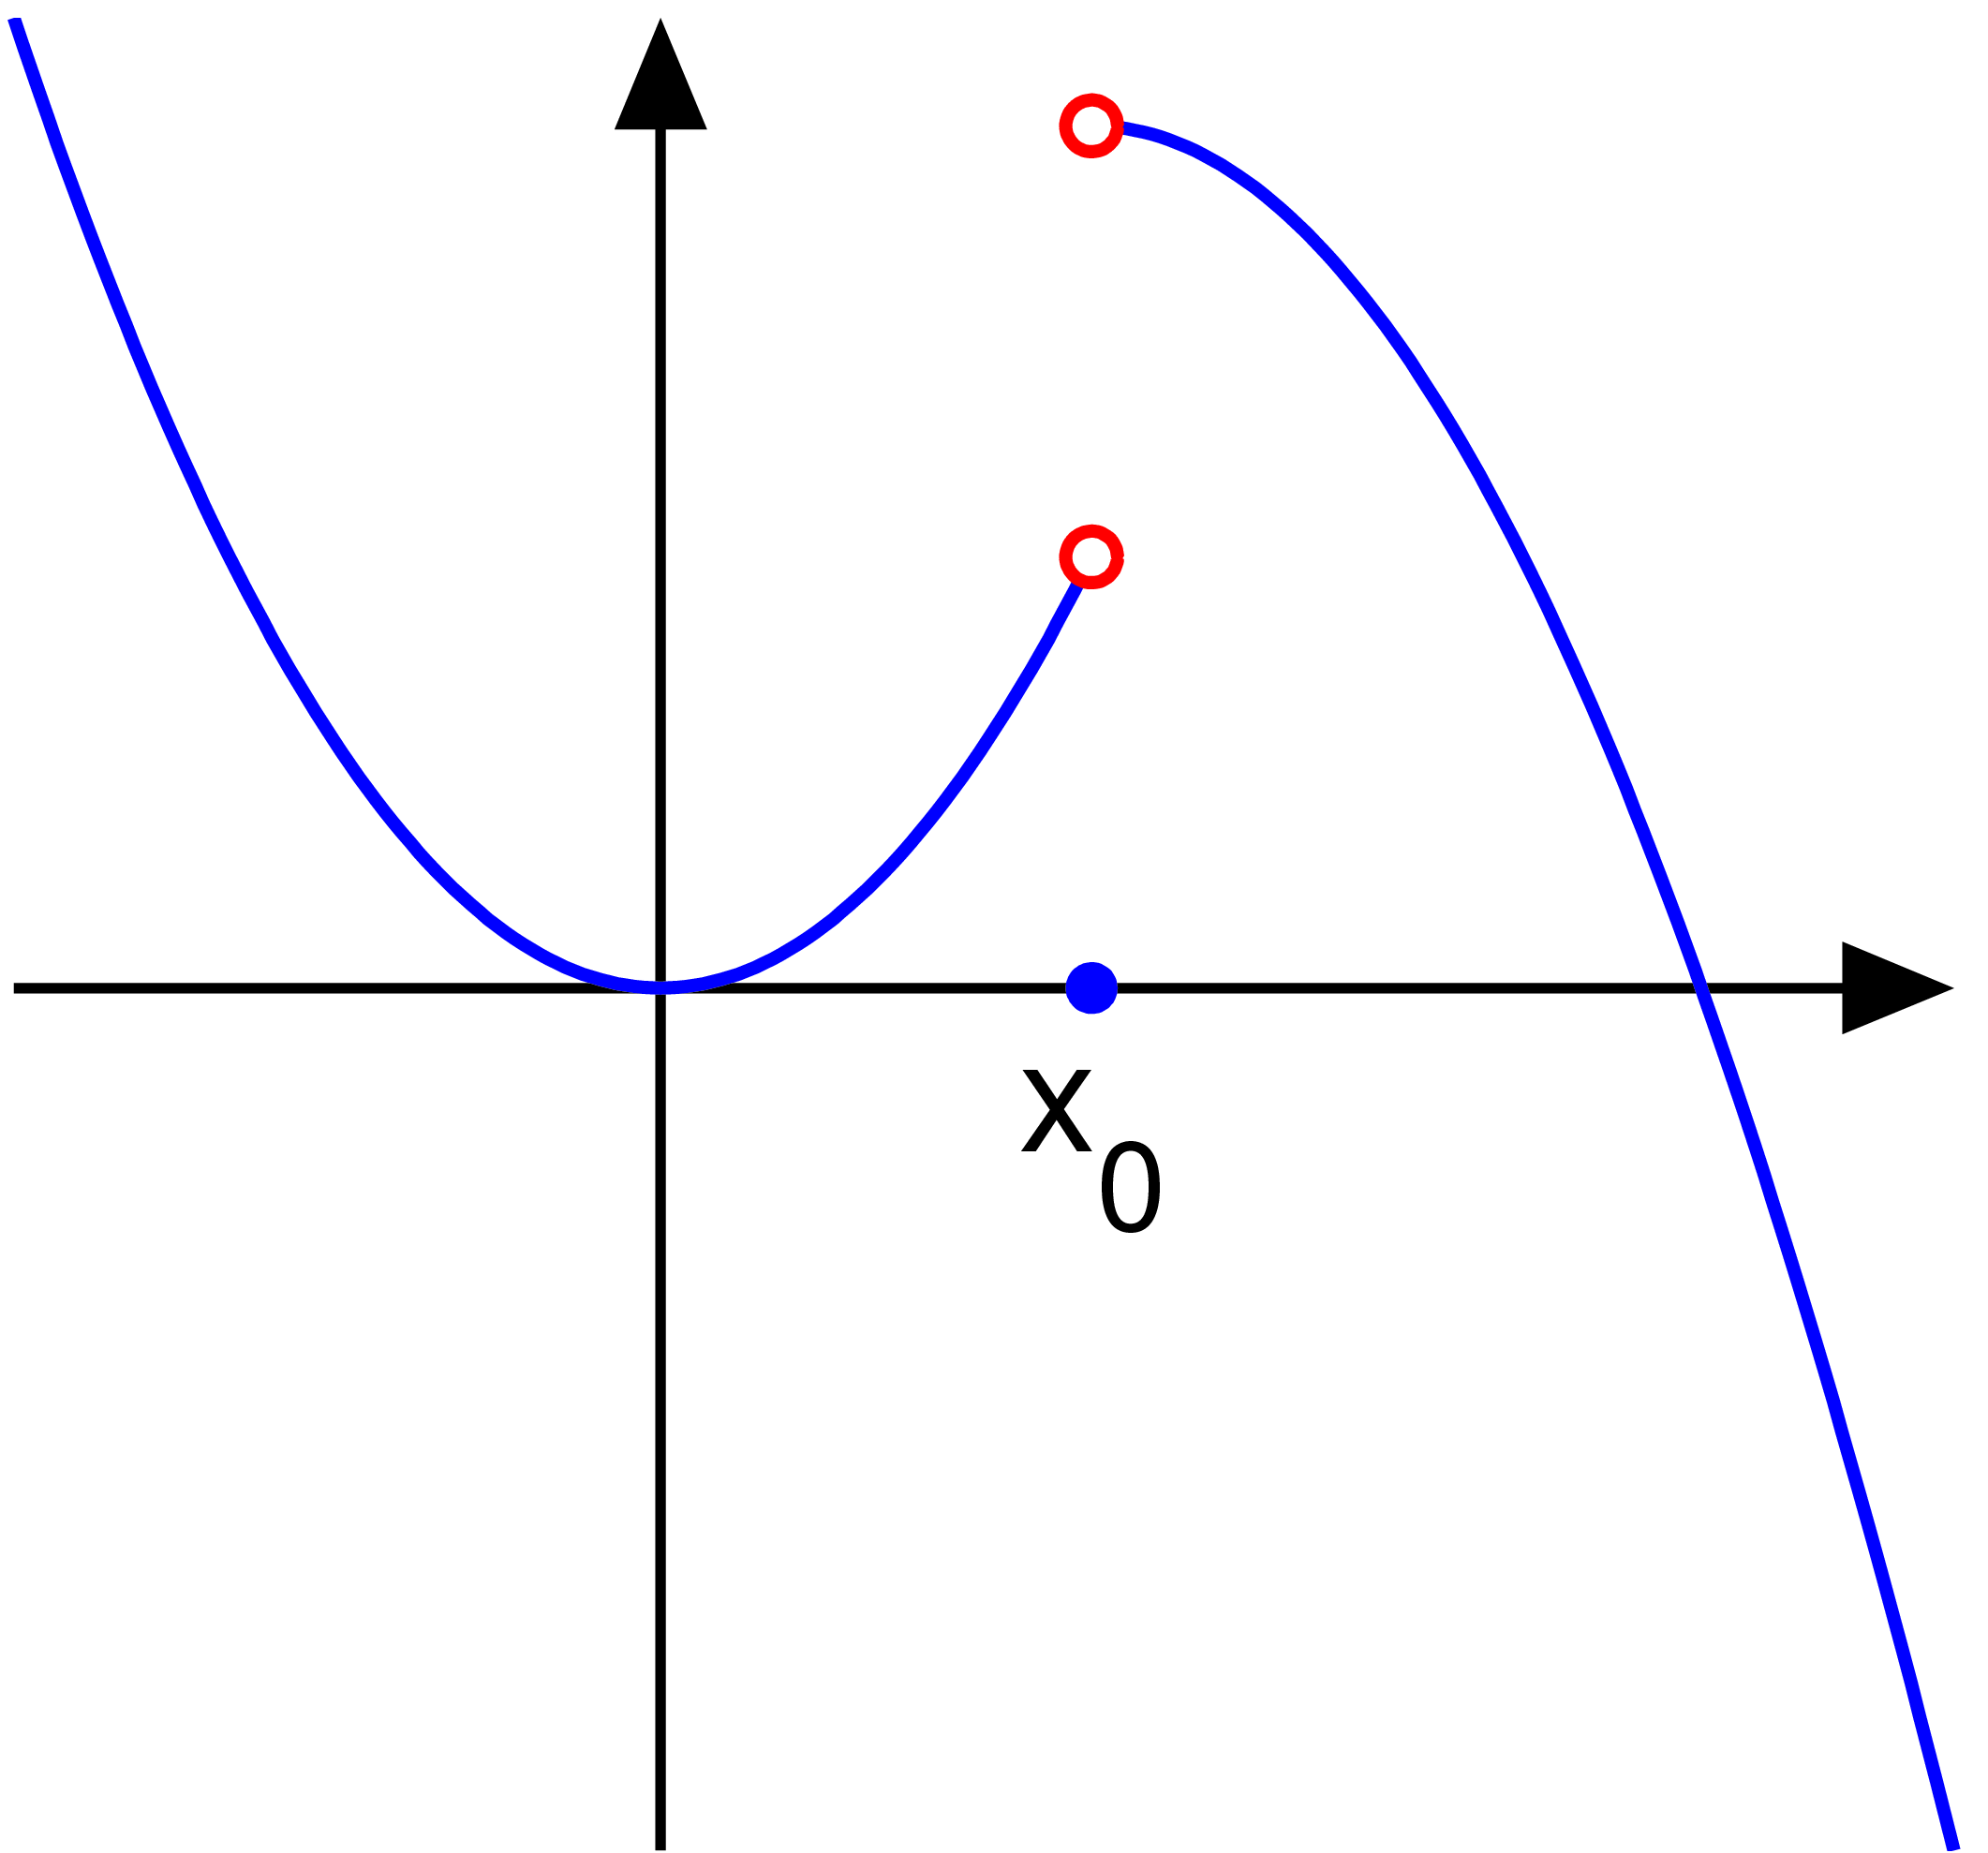
Made by me with matlab. {PD.}
اجازهنامه
[ویرایش]
| من، دارنده حق تکثیر این اثر، این اثر را به مالکیت عمومی منتشر میکنم. این قابل اجرا در تمام نقاط جهان است. در برخی از کشورها ممکن است به صورت قانونی این امکانپذیر نباشد؛ اگر چنین است: من اجازهٔ استفاده از این اثر را برای هر مقصودی، بدون هیچگونه شرایطی میدهم، تا وقتی که این شرایط توسط قانون مستلزم نشده باشد. |
function discontinuity()

   % set up the plotting window
   thick_line=2.5; thin_line=2; arrow_size=14; arrow_type=2;
   fs=30; circrad=0.06;

% picture 1
   a=-1.5; b=3; h=0.02; x0=1;
   X1=a:h:x0; X2=x0:h:b; X=[X1 X2];
   Y1=X1.^2; Y2=Y1(length(Y1))+(-1)*(X2-X2(1)); Y=[Y1 Y2]; y01=Y1(length(Y1)); y02=Y2(1);

   figure(1); clf; hold on; axis equal; axis off;
   axes_points(a, b, thin_line, thick_line, arrow_size, arrow_type, x0, y01, y02, circrad, fs, X, Y, X1, Y1, X2, Y2)
   saveas(gcf, 'discontinuity_removable.eps', 'psc2')

% picture 2
   a=-1.5; b=3; h=0.02; x0=1;
   X1=a:h:x0; X2=x0:h:b; X=[X1 X2];
   Y1=X1.^2; Y2=2-(X2-x0).^2; Y=[Y1 Y2]; y01=Y1(length(Y1)); y02=Y2(1);

   figure(2); clf; hold on; axis equal; axis off;
   axes_points(a, b, thin_line, thick_line, arrow_size, arrow_type, x0, y01, y02, circrad, fs, X, Y, X1, Y1, X2, Y2)
   saveas(gcf, 'discontinuity_jump.eps', 'psc2')

% picture 3
   a=-1.5; b=3; h=0.001; x0=1;
   X1=a:h:x0; X2=x0:h:b; X=[X1 X2];
   Y1=sin(5./(X1-x0-eps)); Y2=0.1./(X2-x0+50*h); Y=[Y1 Y2]; y01=Y1(length(Y1)); y02=Y2(1);

   figure(3); clf; hold on; axis equal; axis off;
   axes_points2(a, b, thin_line, thick_line, arrow_size, arrow_type, x0, NaN, NaN, circrad, fs, X, Y, X1, Y1, X2, Y2)
   saveas(gcf, 'discontinuity_essential.eps', 'psc2')

disp('Converting to png...')
! convert -density 400 -antialias discontinuity_removable.eps discontinuity_removable.png
! convert -density 400 -antialias discontinuity_jump.eps discontinuity_jump.png
! convert -density 400 -antialias discontinuity_essential.eps discontinuity_essential.png

function axes_points(a, b, thin_line, thick_line, arrow_size, arrow_type, x0, y01, y02, circrad, fs, X, Y, X1, Y1, X2, Y2)
   arrow([a 0], [b, 0], thin_line, arrow_size, pi/8,arrow_type, [0, 0, 0]) % xaxis
   small=0.2; arrow([0, min(Y)], [0, max(Y)], thin_line, arrow_size, pi/8,arrow_type, [0, 0, 0]); % y axis

   plot(X1, Y1, 'linewidth', thick_line); plot(X2, Y2, 'linewidth', thick_line)

   ball(x0, 0, circrad, [0 0 1 ]);
   ball_empty(x0, y01, thick_line, circrad, [1 0 0 ]); ball_empty(x0, y02, thick_line, circrad, [1 0 0 ]);
   H=text(x0, -0.006*fs,  'x_0'); set(H, 'fontsize', fs, 'HorizontalAlignment', 'c', 'VerticalAlignment', 'c')

function axes_points2(a, b, thin_line, thick_line, arrow_size, arrow_type, x0, y01, y02, circrad, fs, X, Y, X1, Y1, X2, Y2)
   arrow([a 0], [b, 0], thin_line, arrow_size, pi/8,arrow_type, [0, 0, 0]) % xaxis
   small=0.2; arrow([0, min(Y)], [0, max(Y)], thin_line, arrow_size, pi/8,arrow_type, [0, 0, 0]); % y axis

   plot(X1, Y1, 'linewidth', thick_line); plot(X2, Y2, 'linewidth', thick_line)

   ball(x0, 0, circrad, [0 0 1 ]);
   ball_empty(x0, y01, thick_line, circrad, [1 0 0 ]); ball_empty(x0, y02, thick_line, circrad, [1 0 0 ]);
   H=text(x0+0.2, -0.006*fs,  'x_0'); set(H, 'fontsize', fs, 'HorizontalAlignment', 'c', 'VerticalAlignment', 'c')

function ball(x, y, r, color)
   Theta=0:0.1:2*pi;
   X=r*cos(Theta)+x;
   Y=r*sin(Theta)+y;
   H=fill(X, Y, color);
   set(H, 'EdgeColor', 'none');

function ball_empty(x, y, thick_line, r, color)
   Theta=0:0.1:2*pi;
   X=r*cos(Theta)+x;
   Y=r*sin(Theta)+y;
   H=fill(X, Y, [1 1 1]);
   %set(H, 'EdgeColor', color);
  plot(X, Y, 'color', color, 'linewidth', thick_line);

function arrow(start, stop, thickness, arrowsize, sharpness, arrow_type, color)

%  draw a line with an arrow at the end
%  start is the x,y point where the line starts
%  stop is the x,y point where the line stops
%  thickness is an optional parameter giving the thickness of the lines
%  arrowsize is an optional argument that will give the size of the arrow
%  It is assumed that the axis limits are already set
%  0 < sharpness < pi/4 determines how sharp to make the arrow
%  arrow_type draws the arrow in different styles. Values are 0, 1, 2, 3.

%       8/4/93    Jeffery Faneuff
%       Copyright (c) 1988-93 by the MathWorks, Inc.
%       Modified by Oleg Alexandrov 2/16/03

   if nargin <=6
      color=[0, 0, 0];
   end

   if (nargin <=5)
      arrow_type=0;   % the default arrow, it looks like this: ->
   end

   if (nargin <=4)
      sharpness=pi/4; % the arrow sharpness - default = pi/4
   end

   if nargin<=3
      xl = get(gca,'xlim');
      yl = get(gca,'ylim');
      xd = xl(2)-xl(1);
      yd = yl(2)-yl(1);
      arrowsize = (xd + yd) / 2;   % this sets the default arrow size
   end

   if (nargin<=2)
      thickness=0.5; % default thickness
   end

   xdif = stop(1) - start(1);
   ydif = stop(2) - start(2);

   if (xdif == 0)
      if (ydif >0)
         theta=pi/2;
      else
         theta=-pi/2;
      end
   else
      theta = atan(ydif/xdif);  % the angle has to point according to the slope
   end

   if(xdif>=0)
      arrowsize = -arrowsize;
   end

   if (arrow_type == 0) % draw the arrow like two sticks originating from its vertex
      xx = [start(1), stop(1),(stop(1)+0.02*arrowsize*cos(theta+sharpness)),NaN,stop(1),...
            (stop(1)+0.02*arrowsize*cos(theta-sharpness))];
      yy = [start(2), stop(2), (stop(2)+0.02*arrowsize*sin(theta+sharpness)),NaN,stop(2),...
            (stop(2)+0.02*arrowsize*sin(theta-sharpness))];
      plot(xx,yy, 'LineWidth', thickness, 'color', color)
   end

   if (arrow_type == 1)  % draw the arrow like an empty triangle
      xx = [stop(1),(stop(1)+0.02*arrowsize*cos(theta+sharpness)), ...
            stop(1)+0.02*arrowsize*cos(theta-sharpness)];
      xx=[xx xx(1) xx(2)];

      yy = [stop(2),(stop(2)+0.02*arrowsize*sin(theta+sharpness)), ...
            stop(2)+0.02*arrowsize*sin(theta-sharpness)];
      yy=[yy yy(1) yy(2)];

      plot(xx,yy, 'LineWidth', thickness, 'color', color)

%     plot the arrow stick
      plot([start(1) stop(1)+0.02*arrowsize*cos(theta)*cos(sharpness)], [start(2), stop(2)+ ...
                    0.02*arrowsize*sin(theta)*cos(sharpness)], 'LineWidth', thickness, 'color', color)

   end

   if (arrow_type==2) % draw the arrow like a full triangle
      xx = [stop(1),(stop(1)+0.02*arrowsize*cos(theta+sharpness)), ...
            stop(1)+0.02*arrowsize*cos(theta-sharpness),stop(1)];

      yy = [stop(2),(stop(2)+0.02*arrowsize*sin(theta+sharpness)), ...
            stop(2)+0.02*arrowsize*sin(theta-sharpness),stop(2)];
      H=fill(xx, yy, color);% fill with black
      set(H, 'EdgeColor', 'none')

%     plot the arrow stick
      plot([start(1) stop(1)+0.01*arrowsize*cos(theta)], [start(2), stop(2)+ ...
                    0.01*arrowsize*sin(theta)], 'LineWidth', thickness, 'color', color)
   end

   if (arrow_type==3) % draw the arrow like a filled 'curvilinear' triangle
      curvature=0.5; % change here to make the curved part more curved (or less curved)
      radius=0.02*arrowsize*max(curvature, tan(sharpness));
      x1=stop(1)+0.02*arrowsize*cos(theta+sharpness);
      y1=stop(2)+0.02*arrowsize*sin(theta+sharpness);
      x2=stop(1)+0.02*arrowsize*cos(theta)*cos(sharpness);
      y2=stop(2)+0.02*arrowsize*sin(theta)*cos(sharpness);
      d1=sqrt((x1-x2)^2+(y1-y2)^2);
      d2=sqrt(radius^2-d1^2);
      d3=sqrt((stop(1)-x2)^2+(stop(2)-y2)^2);
      center(1)=stop(1)+(d2+d3)*cos(theta);
      center(2)=stop(2)+(d2+d3)*sin(theta);

      alpha=atan(d1/d2);
      Alpha=-alpha:0.05:alpha;
      xx=center(1)-radius*cos(Alpha+theta);
      yy=center(2)-radius*sin(Alpha+theta);
      xx=[xx stop(1) xx(1)];
      yy=[yy stop(2) yy(1)];

      H=fill(xx, yy, color);% fill with black
      set(H, 'EdgeColor', 'none')

%     plot the arrow stick
      plot([start(1) center(1)-radius*cos(theta)], [start(2), center(2)- ...
                    radius*sin(theta)], 'LineWidth', thickness, 'color', color);
   end
| date/time | username | edit summary |
|---|---|---|
| 04:49, 5 December 2005 | en:User:Oleg Alexandrov | (clean up code) |
| 00:01, 22 November 2005 | en:User:Oleg Alexandrov | (+ source code) |
| 00:52, 12 September 2005 | en:User:Oleg Alexandrov | (Made by me with matlab. {PD.}) |
سیاهه بارگذاری اصلی
[ویرایش]
Legend: (cur) = this is the current file, (del) = delete this old version, (rev) = revert to this old version.
Click on date to download the file or see the image uploaded on that date.
- (del) (cur) 10:30, 20 January 2006 . . DavidHouse ( en:User_talk:DavidHouse Talk) . . 318x297 (10408 bytes) (Reverted to earlier revision)
- (del) (rev) 10:30, 20 January 2006 . . DavidHouse ( en:User_talk:DavidHouse Talk) . . 317x297 (8531 bytes) (Reverted to earlier revision)
- (del) (rev) 01:28, 12 September 2005 . . en:User:Oleg_Alexandrov Oleg Alexandrov ( en:User_talk:Oleg_Alexandrov Talk) . . 318x297 (10408 bytes)
- (del) (rev) 00:52, 12 September 2005 . . en:User:Oleg_Alexandrov Oleg Alexandrov ( en:User_talk:Oleg_Alexandrov Talk) . . 317x297 (8531 bytes) (Made by me with matlab. { PD. })
derivative works
[ویرایش]
آثار انشقاقی از این پرونده: Not defined at x0.svg

|
این math نگاره میبایست با استفاده از گرافیک برداری اسویجی فایل بازسازی شوند. این چند مزیت دارد؛ Commons:Media for cleanup را برای اطلاعات بیشتر ببینید. اگر حالت برداری آن در حال حاضر موجود است، لطفاً آن را بار کنید. پس از بارکردن یک اسویجی، این الگو را با {{vector version available|new image name.svg}} جایگزین کنید.
|
تاریخچهٔ پرونده
روی تاریخ/زمانها کلیک کنید تا نسخهٔ مربوط به آن هنگام را ببینید.
| تاریخ/زمان | بندانگشتی | ابعاد | کاربر | توضیح | |
|---|---|---|---|---|---|
| کنونی | ۱۱ ژوئیهٔ ۲۰۱۳، ساعت ۰۴:۱۷ | | ۲٬۱۲۲ در ۱٬۹۷۸ (۸۱ کیلوبایت) | Oleg Alexandrov (بحث | مشارکتها) | Made the point on the axis blue, per request, this is how it should be. |
| ۱۸ مارس ۲۰۰۶، ساعت ۱۸:۰۹ |  | ۳۱۸ در ۲۹۷ (۱۰ کیلوبایت) | Maksim (بحث | مشارکتها) | La bildo estas kopiita de wikipedia:en. La originala priskribo estas: == Summary == Made by me with matlab. {PD.} == Licensing == {{PD-self}} ==Source code (Matlab) == <pre> <nowiki> function discontinuity() % graph a function which has discontin |
شما نمیتوانید این پرونده را رونویسی کنید.
کاربرد پرونده
صفحههای زیر از این تصویر استفاده میکنند:
کاربرد سراسری پرونده
ویکیهای دیگر زیر از این پرونده استفاده میکنند:
- کاربرد در beta.wikiversity.org
- کاربرد در de.wikipedia.org
- کاربرد در en.wikipedia.org
- کاربرد در en.wikibooks.org
- کاربرد در eo.wikipedia.org
- کاربرد در es.wikipedia.org
- کاربرد در fa.wikipedia.org
- کاربرد در fr.wikipedia.org
- کاربرد در he.wikipedia.org
- کاربرد در it.wikipedia.org
- کاربرد در ja.wikipedia.org
- کاربرد در ko.wikipedia.org
- کاربرد در lmo.wikipedia.org
- کاربرد در nl.wikipedia.org
- کاربرد در no.wikipedia.org
- کاربرد در ru.wikipedia.org
- کاربرد در sv.wikipedia.org
- کاربرد در tl.wikipedia.org
- کاربرد در www.wikidata.org
- کاربرد در zh.wikipedia.org