File:Einwohner-Bunde-2010.svg
Jump to navigation
Jump to search

Size of this PNG preview of this SVG file: 600 × 480 pixels. Other resolutions: 300 × 240 pixels | 960 × 768 pixels | 1,280 × 1,024 pixels | 2,560 × 2,048 pixels.
Original file (SVG file, nominally 600 × 480 pixels, file size: 12 KB)
Captions
Captions
Add a one-line explanation of what this file represents
Summary
[edit]
| Description |
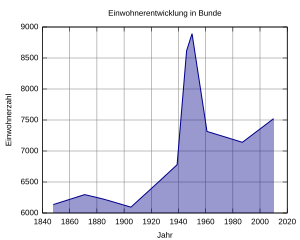
Deutsch: Eimwohnerentwicklung von Bunde bis 2010 |
| Date | |
| Source | Own work |
| Author | A1000 |
| SVG development | |
| Source code | Gnuplot code#!/usr/bin/gnuplot
# gnuplot 4.2
unset key
set style data lines
set style fill solid 0.4
set grid
set xlabel 'Jahr'
set ylabel 'Einwohnerzahl'
set title 'Einwohnerentwicklung in Bunde'
set terminal svg
set output "Einwohner-Bunde-2010.svg"
plot '-' with filledcurves below x1 lt rgb 'dark-blue' lw 2 notitle
1848 6137
1871 6297
1885 6223
1905 6094
1925 6494
1939 6779
1946 8618
1950 8893
1961 7315
1987 7140
2010 7522
e
|
Licensing
[edit]
I, the copyright holder of this work, hereby publish it under the following licenses:

|
Permission is granted to copy, distribute and/or modify this document under the terms of the GNU Free Documentation License, Version 1.2 or any later version published by the Free Software Foundation; with no Invariant Sections, no Front-Cover Texts, and no Back-Cover Texts. A copy of the license is included in the section entitled GNU Free Documentation License. |
| This file is licensed under the Creative Commons Attribution-Share Alike 3.0 Unported license. | ||
| ||
| This licensing tag was added to this file as part of the GFDL licensing update. |
You may select the license of your choice.
File history
Click on a date/time to view the file as it appeared at that time.
| Date/Time | Thumbnail | Dimensions | User | Comment | |
|---|---|---|---|---|---|
| current | 17:18, 10 February 2012 | | 600 × 480 (12 KB) | A1000 (talk | contribs) | {{Information |Description={{de|Eimwohnerentwicklung von Bunde bis 2010}} |Source={{own}} |Date= 2012 |Author= (~~~) |Permission= |other_versions= }} == {{int:license}} == {{Self|GFDL|Cc-by-sa-3.0-migrated}} <pre> #!/usr/bin/gnuplot # gnuplot 4.2 unse |
You cannot overwrite this file.
File usage on Commons
The following page uses this file: