File:England and Wales population cartogram.svg
Jump to navigation
Jump to search

Size of this PNG preview of this SVG file: 508 × 599 pixels. Other resolutions: 203 × 240 pixels | 407 × 480 pixels | 651 × 768 pixels | 868 × 1,024 pixels | 1,736 × 2,048 pixels | 1,006 × 1,187 pixels.
Original file (SVG file, nominally 1,006 × 1,187 pixels, file size: 737 KB)
Captions
Captions
Add a one-line explanation of what this file represents
Summary
[edit]
| Description |
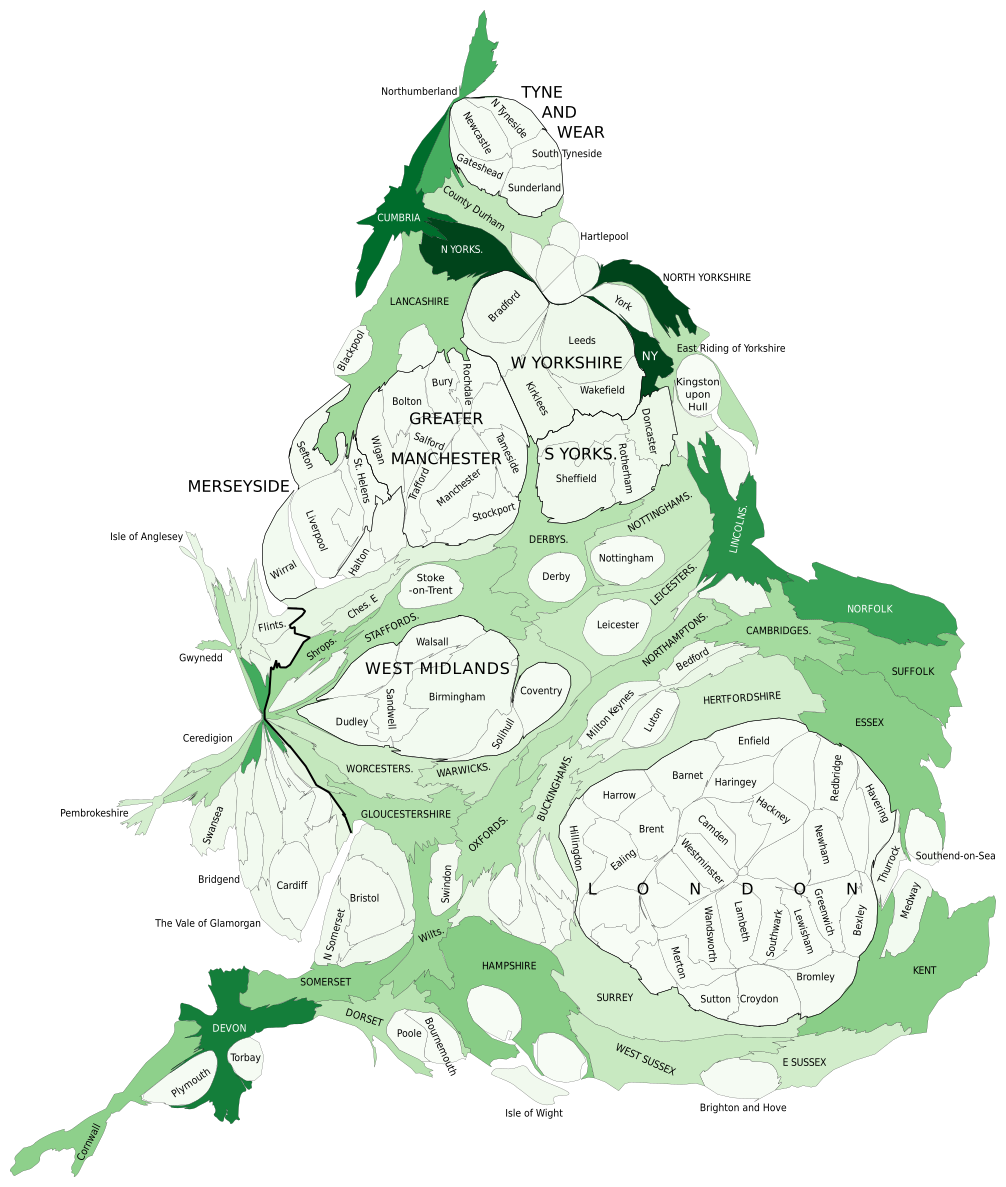
Polski: Kartogram ludności Anglii i Walii. Liczba ludności według jednostek administracyjnych. Ich wielkość jest w przybliżeniu proporcjonalna do liczby mieszkańców według danych z cenzusu z 2011. Im ciemniejszy kolor tym większa rzeczywista powierzchnia. English: Population by administrative areas. Their size is approximately in proportion to their population according to 2011 Census data. The darker colour the bigger is the real area |
| Date | |
| Source | Own work |
| Author | PawełS |
| SVG development |
Licensing
[edit]
I, the copyright holder of this work, hereby publish it under the following license:
This file is licensed under the Creative Commons Attribution-Share Alike 3.0 Unported license.
- You are free:
- to share – to copy, distribute and transmit the work
- to remix – to adapt the work
- Under the following conditions:
- attribution – You must give appropriate credit, provide a link to the license, and indicate if changes were made. You may do so in any reasonable manner, but not in any way that suggests the licensor endorses you or your use.
- share alike – If you remix, transform, or build upon the material, you must distribute your contributions under the same or compatible license as the original.
File history
Click on a date/time to view the file as it appeared at that time.
| Date/Time | Thumbnail | Dimensions | User | Comment | |
|---|---|---|---|---|---|
| current | 21:30, 27 February 2013 | | 1,006 × 1,187 (737 KB) | PawełS (talk | contribs) | User created page with UploadWizard |
You cannot overwrite this file.
File usage on Commons
There are no pages that use this file.