File:Exponential Function (Imag Part).png
Aller à la navigation
Aller à la recherche

Taille de cet aperçu : 728 × 600 pixels. Autres résolutions : 292 × 240 pixels | 583 × 480 pixels | 933 × 768 pixels | 1 244 × 1 024 pixels | 1 700 × 1 400 pixels.
Fichier d’origine (1 700 × 1 400 pixels, taille du fichier : 630 kio, type MIME : image/png)
Légendes
Légendes
Ajoutez en une ligne la description de ce que représente ce fichier
| Description |
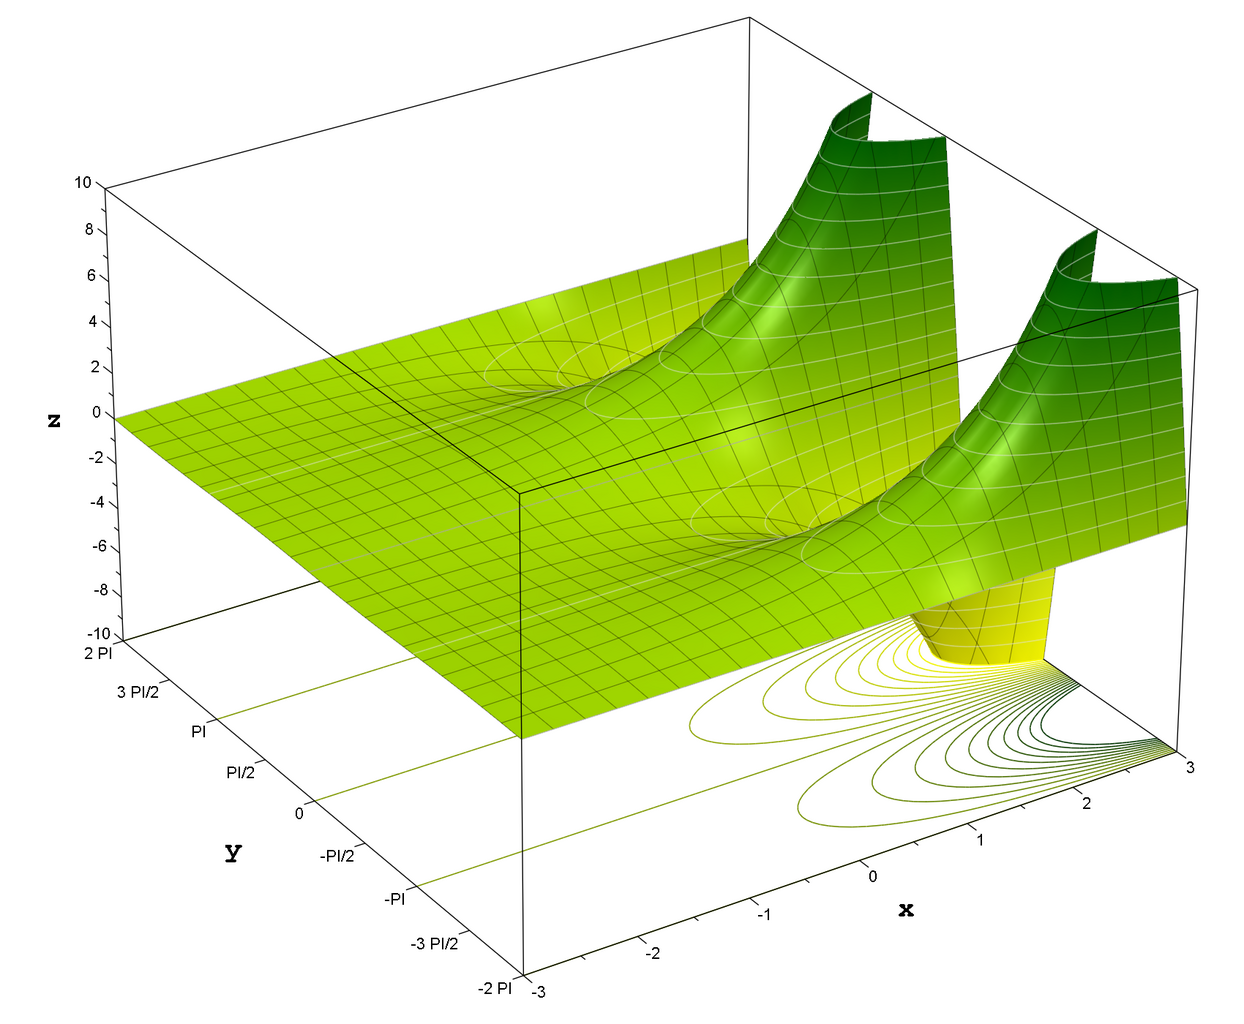
Diagram of the real part of exponetial function in the complex plane. The surface is given by: |
||
| Date | |||
| Source | Own drawing, Plotted in MuPAD | ||
| Auteur | Inductiveload | ||
| Autorisation (Réutilisation de ce fichier) |
|

MuPAD Code[modifier]
.png&action=edit§ion=1)
  q := Im(exp(x+I*y)):

  conts := 21:
  projectionlevel:=-10:
  ylimit := 2*PI:
  xlimit := 3:
  submeshlevel := 4:
  approx := 20:

colourfunc := zip(RGB::DarkGreen, RGB::Yellow,
                  (a, b) -> (q(x,y)+10)/(12)*a
                           -(q(x,y)-10)/(20)*b):

funcplot := plot::Function3d(q(x,y),
                             x = -xlimit..xlimit,
                             y = -ylimit..ylimit,
                             Mesh = [23, 23],
                             Submesh = [submeshlevel,submeshlevel],
                             LineColor = RGB::Black.[0.4],
                             LineWidth = 0.15,
                             FillColorFunction = colourfunc,
                             AxesTitleFont = ["Courier New", Bold, 14],
                             ViewingBoxZRange = -10..10,
                             YTicksNumber = None,
                             YTicksAt = [-3*PI/2 = "-3 PI/2", -PI = "-PI", -PI/2 = "-PI/2", -2*PI = "-2 PI",
                                         0 = "0",
                                         PI/2 = "PI/2", PI = "PI",  3*PI/2 = "3 PI/2", 2*PI = "2 PI"]
                            ):

contours := plot::modify(funcplot,
                         ZContours = [Automatic, conts],
                         LineWidth = 0.2,
                         LineColor = RGB::Gray90.[0.5],
                         XLinesVisible = FALSE,
                         YLinesVisible = FALSE,
                         Filled = FALSE
                        ):

projcontours := plot::Transform3d([0, 0, projectionlevel],
                                  [1, 0, 0, 0, 1, 0, 0, 0, 0],
                                   plot::modify(funcplot, ZContours = [Automatic, conts],
                                                LineWidth = 0.2,
                                                LineColorType = Dichromatic,
                                                LineColor = RGB::DarkGreen.[0.99],
                                                LineColor2 = RGB::Yellow.[0.99],
                                                XLinesVisible = FALSE,
                                                YLinesVisible = FALSE,
                                                Filled = FALSE
                                               )
                                  ):

camera := plot::Camera([-25, -80, 120],
                       [-0.5, -1, 0],
                       0.15
                      ):

ploteverything := plot::Canvas(funcplot, contours, projcontours,
                               Width = 8.5*unit::inch,
                               Height = 7*unit::inch,
                               camera
                              ):

plot(ploteverything)
Historique du fichier
Cliquer sur une date et heure pour voir le fichier tel qu'il était à ce moment-là.
| Date et heure | Vignette | Dimensions | Utilisateur | Commentaire | |
|---|---|---|---|---|---|
| actuel | 20 avril 2007 à 15:29 | | 1 700 × 1 400 (630 kio) | Inductiveload (d | contributions) | {{Information |Description=Diagram of the real part of exponetial function in the complex plane. The surface is given by: ::<math>z=\operatorname{Re} \left (\exp \left( x + i y \right)\right)</math> |Source=Own drawing, Plotted in MuPAD |Date=20/04/2007 | |
Vous ne pouvez pas remplacer ce fichier.
Utilisations locales du fichier
La page suivante utilise ce fichier :
Utilisations du fichier sur d’autres wikis
Les autres wikis suivants utilisent ce fichier :
- Utilisation sur en.wikipedia.org
- Utilisation sur en.wikibooks.org
- Utilisation sur et.wikipedia.org
- Utilisation sur fr.wikipedia.org
- Utilisation sur ja.wikipedia.org
.png&oldid=485210899)