File:F2-large.jpg
Jump to navigation
Jump to search

Size of this preview: 800 × 580 pixels. Other resolutions: 320 × 232 pixels | 640 × 464 pixels | 1,024 × 742 pixels | 1,280 × 928 pixels.
Original file (1,280 × 928 pixels, file size: 253 KB, MIME type: image/jpeg)
Captions
Captions
Add a one-line explanation of what this file represents
Summary
[edit]
| Description |
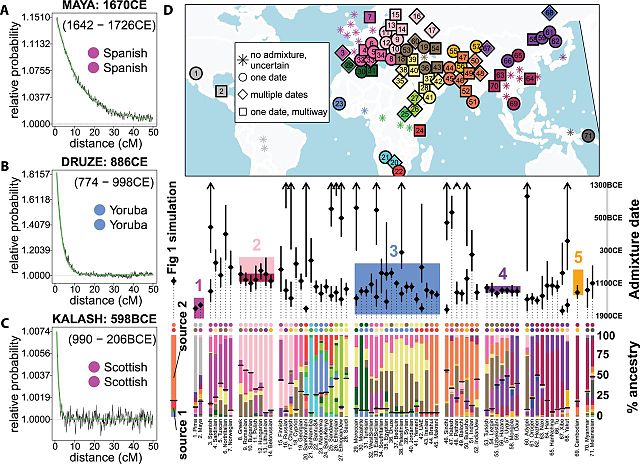
English: Overview of inferred admixture for 95 human populations
(A) Coancestry curve for the Maya for Spanish donor group (inferred as closest to minor admixing source), with green fitted line showing inferred exponential decay curve and a corresponding recent admixture date (with 95% CI). (B, C) As A, but showing the Druze and Kalash respectively, with different indicated donors (donors indicated are proxies for minor admixing source, inferred as closest to Yoruba and Germany/Austria, respectively) and with successively older admixture. (D) On the map (locations approximate in densely sampled regions), shapes (see legend) indicate inference: no admixture, a single admixture event, or more complex admixture; colors indicate fineSTRUCTURE clustering into 18 clades (Table S11, Figs. S12-S13). Inferred date(s), 95% CIs are directly below the map, with two inferred admixing sources (dots and vertical bars) shown below each date (see example for simulation of Fig. 1 at left). For multiple admixture times, these two sources correspond to the more recent event; for multiple groups, they reflect the strongest admixture “direction”. Colored dots above each bar indicate clades best representing the major (top) and minor (bottom) sources. The bar is split at the inferred admixture fraction (horizontal line, fractions < 5% shown as 5%). Each bar section indicates inferred donor group haplotypic make-up, colored as the map, for one source. Shaded boxes on the inferred admixture times denote events referred to in the text, specifically 1. European colonization of the Americas (1492CE-present; hot pink), 2. Slavic (500-900CE; pink), Turkic (500-1100CE; maroon) migrations, 3. Arab slave trade (650-1900CE; cyan), 4. Mongol Empire (1206-1368CE; purple), and 5. Khmer Empire (802-1431CE; orange). |
| Date | |
| Source | A genetic atlas of human admixture history[1] |
| Author | Garrett Hellenthal, George B.J. Busby, Gavin Band, James F. Wilson, Cristian Capelli, Daniel Falush, and Simon Myers |
Licensing
[edit]
This file is licensed under the Creative Commons Attribution-Share Alike 2.5 Generic license.
- You are free:
- to share – to copy, distribute and transmit the work
- to remix – to adapt the work
- Under the following conditions:
- attribution – You must give appropriate credit, provide a link to the license, and indicate if changes were made. You may do so in any reasonable manner, but not in any way that suggests the licensor endorses you or your use.
- share alike – If you remix, transform, or build upon the material, you must distribute your contributions under the same or compatible license as the original.
File history
Click on a date/time to view the file as it appeared at that time.
| Date/Time | Thumbnail | Dimensions | User | Comment | |
|---|---|---|---|---|---|
| current | 21:43, 27 May 2016 | | 1,280 × 928 (253 KB) | Userius (talk | contribs) | User created page with UploadWizard |
You cannot overwrite this file.
File usage on Commons
There are no pages that use this file.