File:Fahrgastzahlen MVV.svg
Jump to navigation
Jump to search

Size of this PNG preview of this SVG file: 800 × 600 pixels. Other resolutions: 320 × 240 pixels | 640 × 480 pixels | 1,024 × 768 pixels | 1,280 × 960 pixels | 2,560 × 1,920 pixels.
Original file (SVG file, nominally 800 × 600 pixels, file size: 20 KB)
Captions
Captions
Add a one-line explanation of what this file represents
Summary
[edit]
| Description |
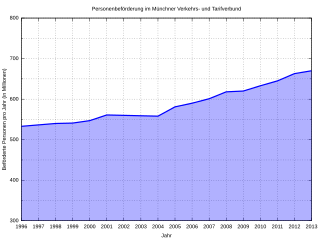
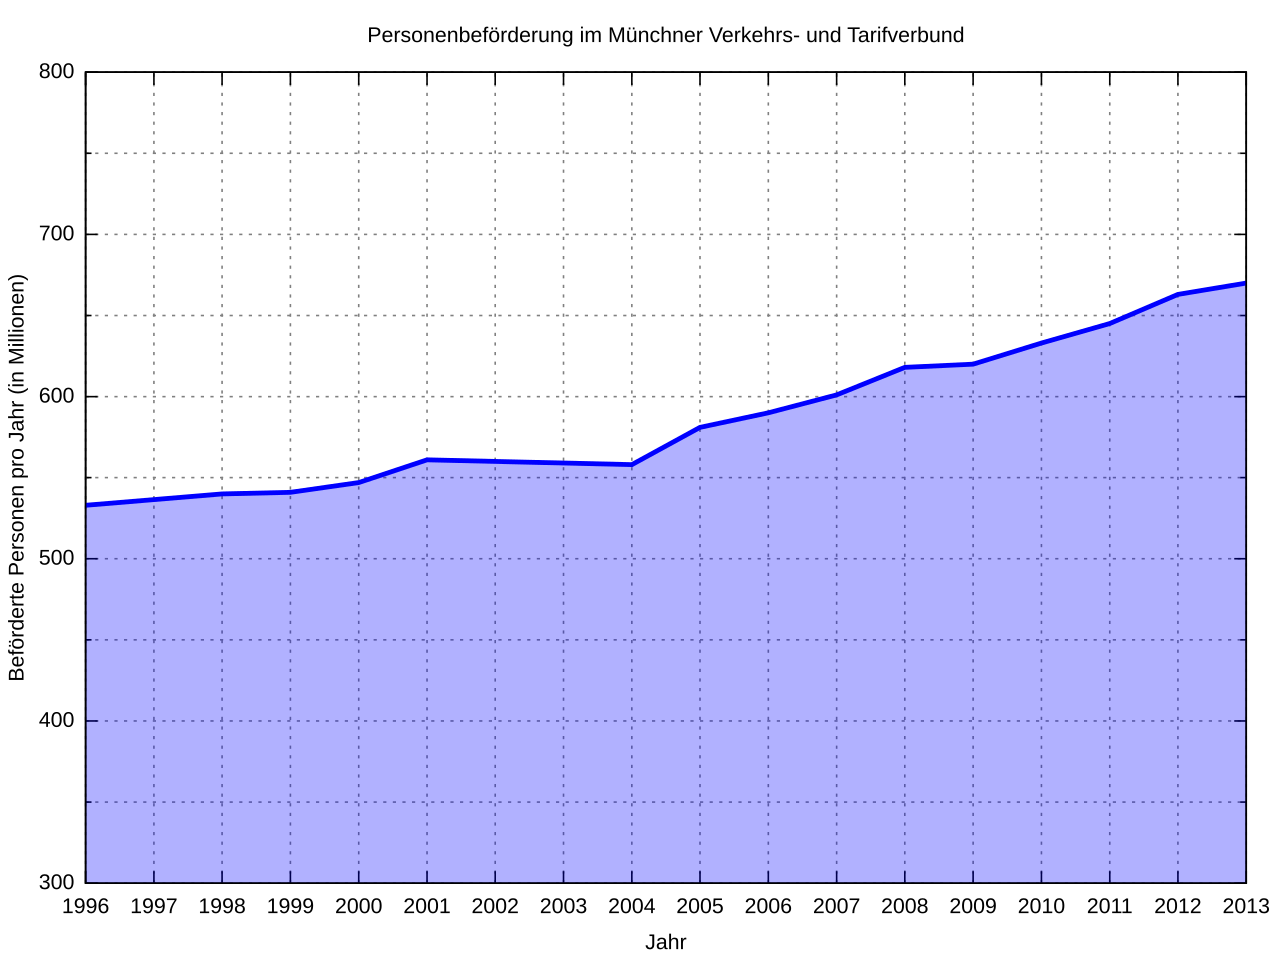
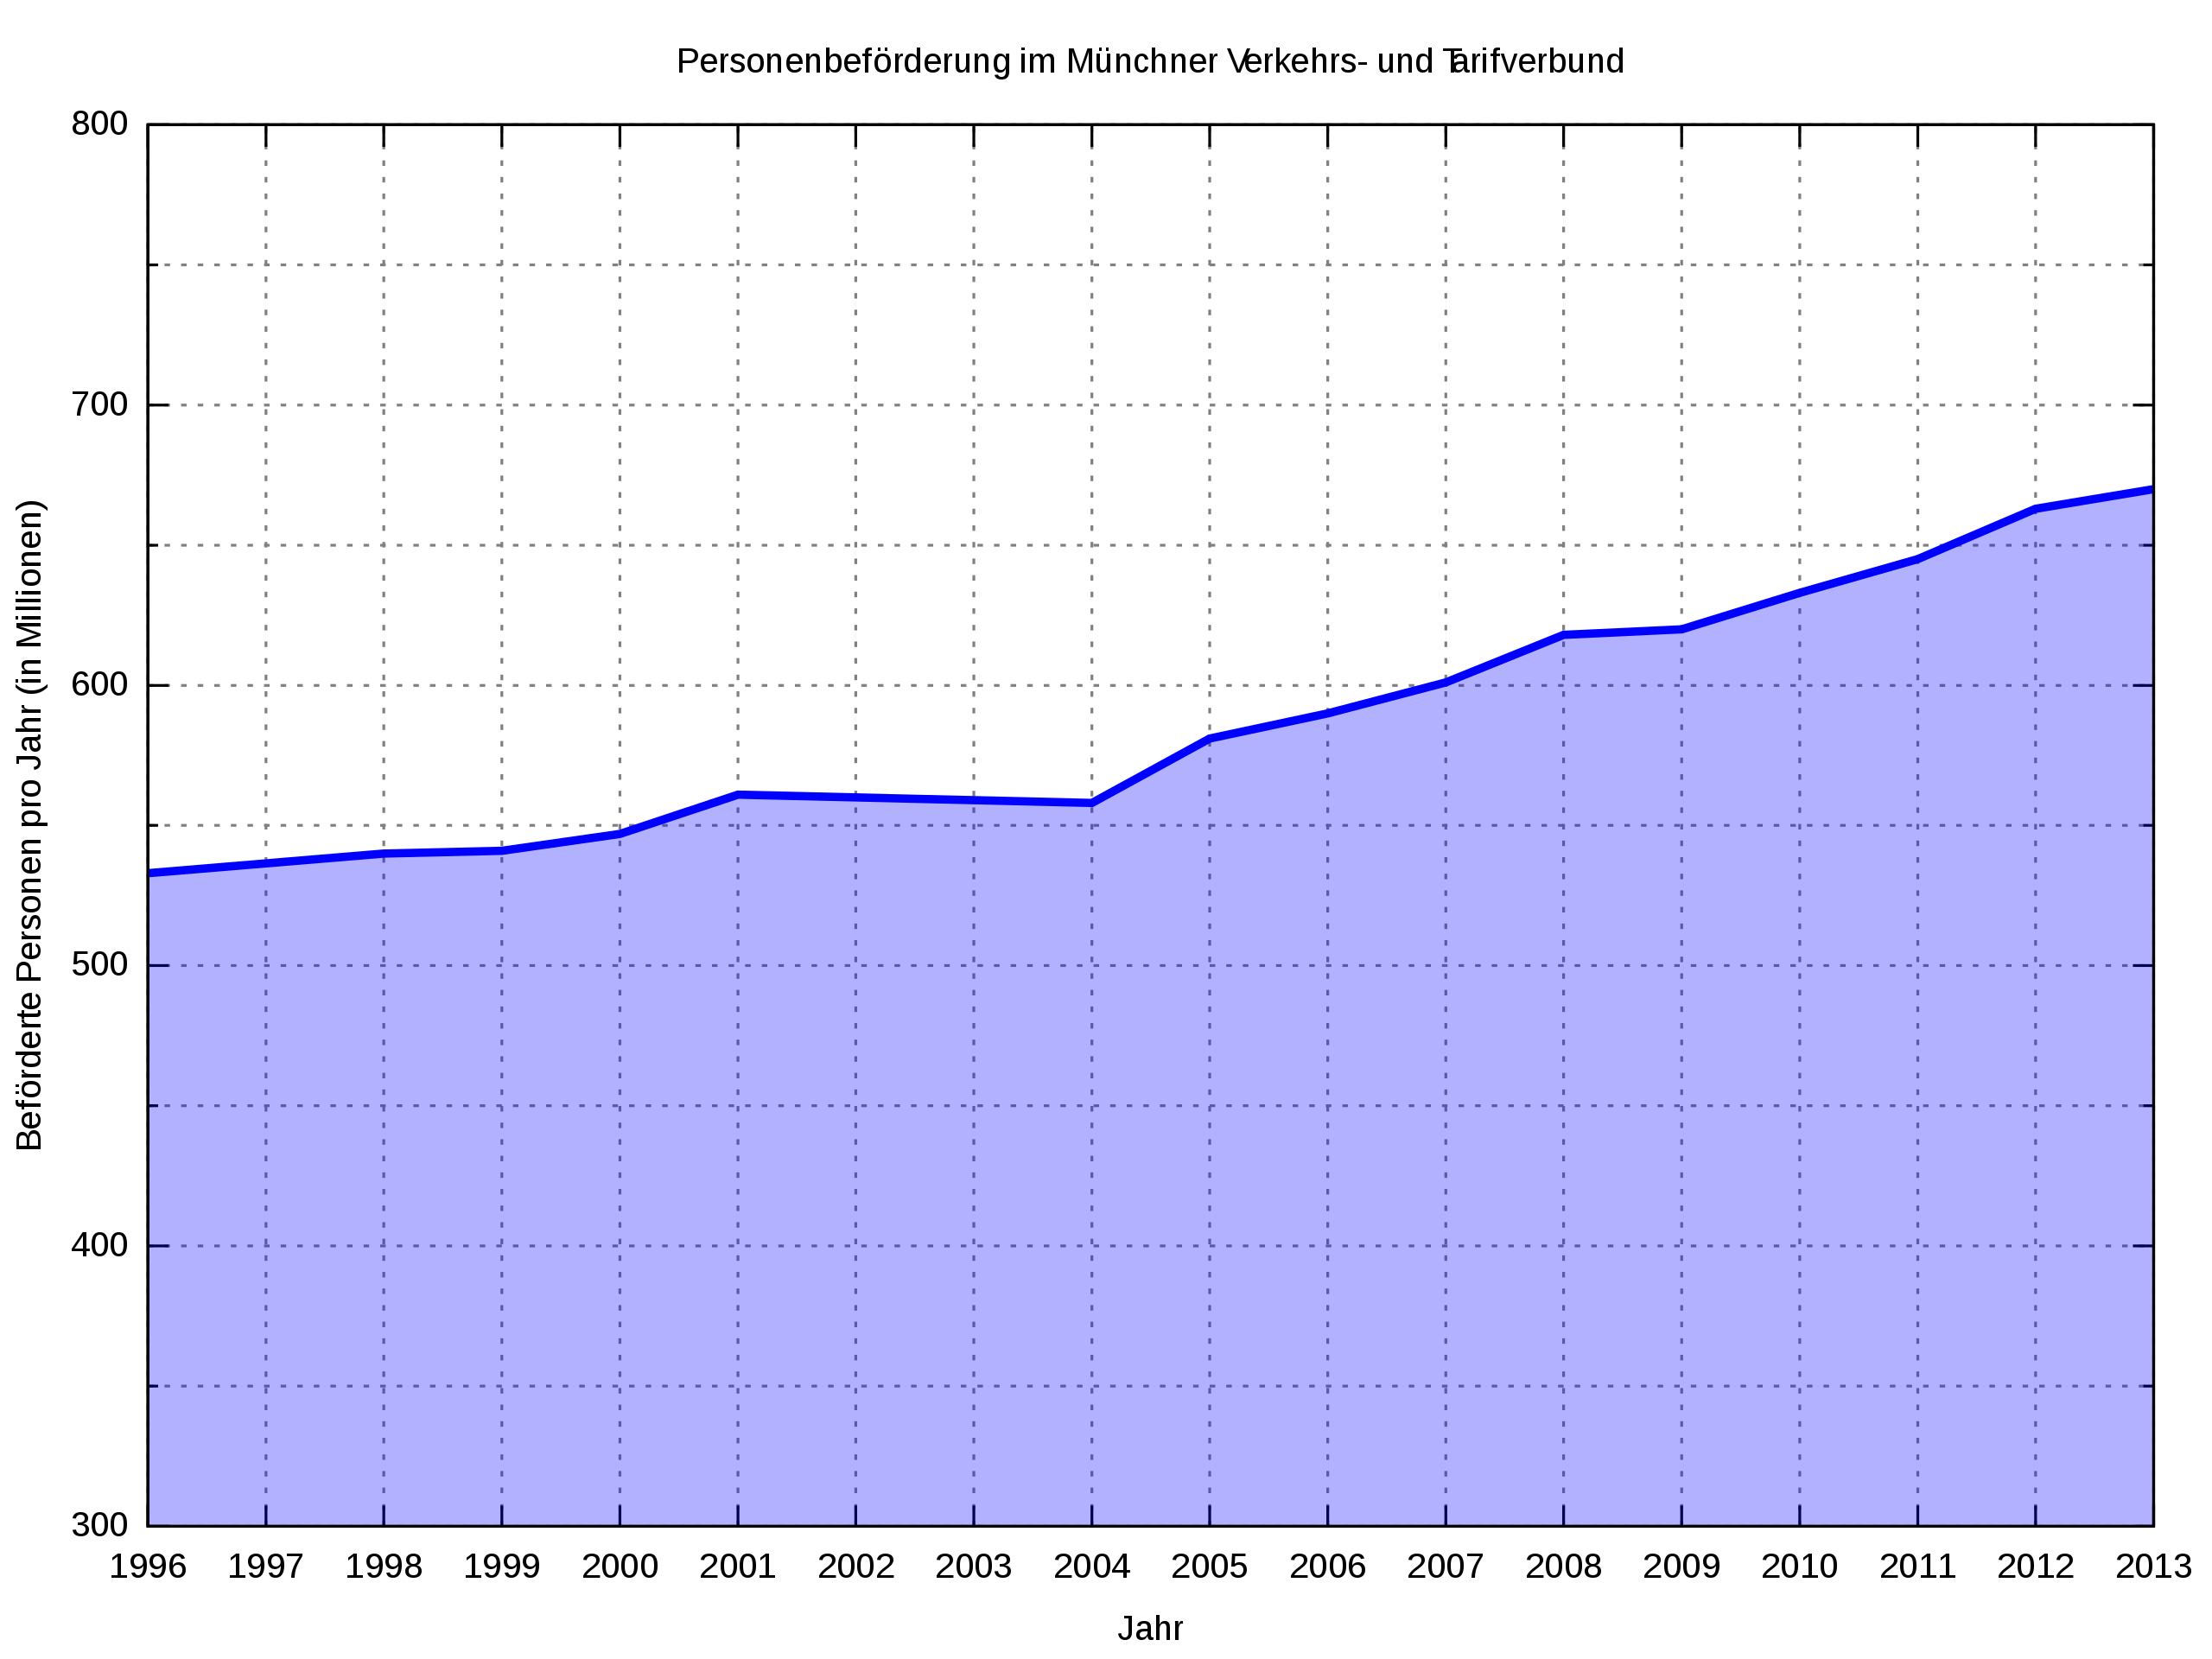
Deutsch: Fahrgastzahlen im Münchner Verkehrs- und Tarifverbund |
| Date | |
| Source | Bundesministerium für Verkehr, Bau und Stadtentwicklung (Hrsg.): Verkehr in Zahlen 2014/2015. DVV Media Group, Hamburg 2014, ISBN 978-3-87154-516-0, S. 82. |
| Author | EveryPicture |
Licensing
[edit]
I, the copyright holder of this work, hereby publish it under the following license:
This file is licensed under the Creative Commons Attribution-Share Alike 3.0 Unported license.
- You are free:
- to share – to copy, distribute and transmit the work
- to remix – to adapt the work
- Under the following conditions:
- attribution – You must give appropriate credit, provide a link to the license, and indicate if changes were made. You may do so in any reasonable manner, but not in any way that suggests the licensor endorses you or your use.
- share alike – If you remix, transform, or build upon the material, you must distribute your contributions under the same or compatible license as the original.
Gnuplot Source code
[edit]
# Erstellt von EveryPicture mit Gnuplot Online, http://gnuplot.respawned.com/
# Lizenz: CC-BY-SA 3.0 unported, https://creativecommons.org/licenses/by-sa/3.0/deed.de
# Basierend auf http://commons.wikimedia.org/wiki/File:Bayreuth_Bevoelkerungsentwicklung.svg von Michael Fiedler <michael.fiedler87@gmx.de>
# Dieser Quelltext ist bezogen auf die erste Version des Diagramms von EveryPicture.

set title 'Personenbeförderung im Münchner Verkehrs- und Tarifverbund'
unset key
set style fill transparent solid 0.3
set grid xtics ytics mytics

set xlabel 'Jahr'
# Definitionsbereich
set xrange [1996:2013]
# Einteilung der x-Achse
set xtics 1

set ylabel 'Beförderte Personen pro Jahr (in Millionen)'
# Wertebereich
set yrange [300:800]
# Einteilung der y-Achse
set ytics 100
set format y '%.0f'
set mytics 2
set terminal svg size 800,600 font 'Arial,10'
set output 'Ausgabedatei.svg'

# '-' nimmt die nachfolgenden Daten als Eingabewerte
plot '-' using 1:($2) with filledcurves below x1 linetype rgb 'blue' linewidth 3, \
# Datenquelle: Bundesministerium für Verkehr, Bau und Stadtentwicklung (Hrsg.): Verkehr in Zahlen 2014/2015.
1996 533
1998 540
1999 541
2000 547
2001 561
2004 558
2005 581
2006 590
2007 601
2008 618
2009 620
2010 633
2011 645
2012 663
2013 670
e
# Reisewege mit Umstieg wurden einfach gezählt.
File history
Click on a date/time to view the file as it appeared at that time.
| Date/Time | Thumbnail | Dimensions | User | Comment | |
|---|---|---|---|---|---|
| current | 22:09, 25 December 2015 | | 800 × 600 (20 KB) | EveryPicture (talk | contribs) | User created page with UploadWizard |
You cannot overwrite this file.
File usage on Commons
The following page uses this file:
File usage on other wikis
The following other wikis use this file:
- Usage on de.wikipedia.org
- Usage on en.wikipedia.org
- Usage on zh.wikipedia.org