File:Flow Cytometry Chart.jpg
Jump to navigation
Jump to search
Size of this preview: 413 × 599 pixels. Other resolutions: 165 × 240 pixels | 503 × 729 pixels.
Original file (503 × 729 pixels, file size: 74 KB, MIME type: image/jpeg)
Captions
Captions
Add a one-line explanation of what this file represents
Summary[edit]
| Description |
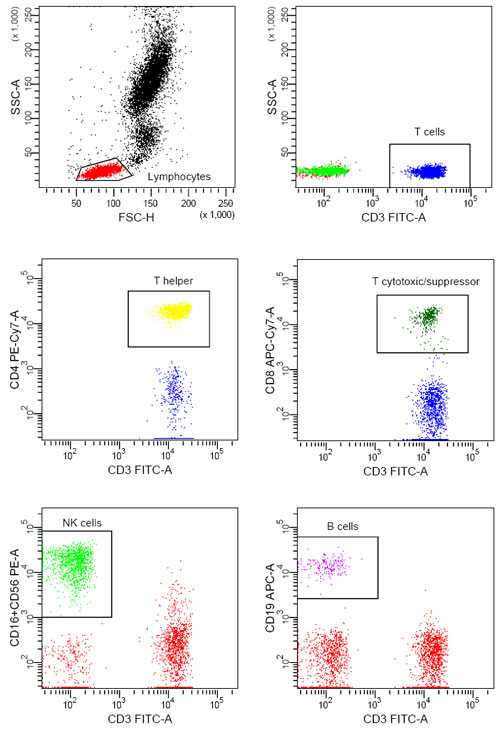
English: Pictured above is a Flow Cytometry chart. The upper right picture shows the full Flow Cytometry chart with all cells listed and the lymphocytes (lymphoid cells) are highlighted. Each other chart shows a zoomed picture of each type of lymphocyte. If one were to see a deficiency of one type of cell, that would lead to a leukemia. The flow cytometer is used to count and visualize the amount of white blood cells that cannot be deciphered under a microscope. |
| Date | |
| Source | Own work |
| Author | CharlotteHayden |
Licensing[edit]
I, the copyright holder of this work, hereby publish it under the following license:
This file is licensed under the Creative Commons Attribution-Share Alike 4.0 International license.
- You are free:
- to share – to copy, distribute and transmit the work
- to remix – to adapt the work
- Under the following conditions:
- attribution – You must give appropriate credit, provide a link to the license, and indicate if changes were made. You may do so in any reasonable manner, but not in any way that suggests the licensor endorses you or your use.
- share alike – If you remix, transform, or build upon the material, you must distribute your contributions under the same or compatible license as the original.
File history
Click on a date/time to view the file as it appeared at that time.
| Date/Time | Thumbnail | Dimensions | User | Comment | |
|---|---|---|---|---|---|
| current | 19:46, 23 November 2016 | | 503 × 729 (74 KB) | CharlotteHayden (talk | contribs) | Cross-wiki upload from en.wikipedia.org |
You cannot overwrite this file.
File usage on Commons
There are no pages that use this file.