File:Gaia’s Hertzsprung-Russell diagram ESA393151.jpg

原始檔案 (2,480 × 3,754 像素,檔案大小:1.46 MB,MIME 類型:image/jpeg)
說明
說明


摘要
[編輯]
| 描述 |
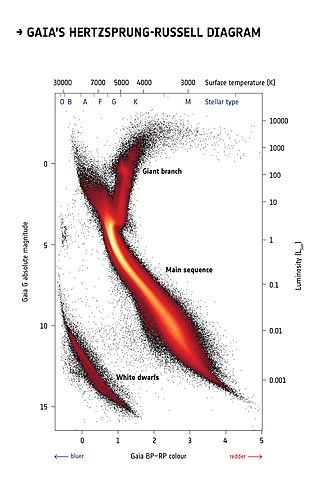
English: More than four million stars within five thousand light-years from the Sun are plotted on this diagram using information about their brightness, colour and distance from the second data release from ESA’s Gaia satellite. It is known as a Hertzsprung-Russell diagram after the astronomers who devised it in the early 20th century, and it is a fundamental tool to study populations of stars and their evolution.
This Hertzsprung-Russell diagram, obtained by a selection of stars in Gaia’s second release catalogue, is the most detailed to date made by mapping stars over the entire sky, containing roughly a hundred times more stars thanthe one obtained using data from ESA’s Hipparcos mission, the predecessor of Gaia, in the 1990s. This new diagram contains so much highly accurate information that astronomers have been able to identify fine details that were never before seen. The Hertzsprung-Russell diagram can be imagined as a stellar family portrait: stars are plotted according to their colour (on the horizontal axis) and brightness (on the vertical axis) and are grouped in different regions of the diagram depending mainly on their masses, chemical composition, ages, and stages in the stellar life cycle. Information about stellar distances is fundamental to calculate the true brightness, or absolute magnitude, of stars. Brighter stars are shown in the top part of the diagram, while fainter stars are in the lower part. Bluer stars, which have hotter surfaces, are on the left, and redder stars, with cooler surfaces, on the right. The colour scale in this image does not represent the colour of stars but is a representation of how many stars are plotted in each portion of the diagram: black represents lower numbers of stars, while red, orange and yellow correspond to increasingly higher numbers of stars. The large diagonal stripe across the centre of the graph is known as the main sequence. This is where fully-fledged stars that are generating energy by fusing hydrogen into helium are found. Massive stars, which have bluer or whiter colours, are found in the upper left end of the main sequence, while intermediate-mass stars like our Sun, characterised by yellow colours, are located mid-way. Redder, low-mass stars are found towards the lower right. As stars age they swell up, becoming brighter and redder. Stars experiencing this are shown on the diagram as the vertical arm leading off the main sequence and turning to the right. This is known as the red giant branch. While the most massive stars swell into red giants and explode as powerful supernovae, stars like our Sun end their days in a less spectacular fashion, eventually turning into white dwarfs – the hot cores of dead stars. These are found in the lower left of the diagram. The huge leap forward from Hipparcos to Gaia is especially visible in thewhite dwarf region of the diagram. While Hipparcos had obtained reliable distance measurements to only a handful of white dwarfs, more than 35 000 such objects are included in this diagram based on Gaia data. This allows astronomers to see the signature of different types of white dwarfs such that a differentiation can be made between those with hydrogen-rich cores and those dominated by helium. Acknowledgement: Gaia Data Processing and Analysis Consortium (DPAC); Carine Babusiaux, IPAG – Université Grenoble Alpes, GEPI – Observatoire de Paris, France. |
| 日期 | |
| 來源 | http://www.esa.int/spaceinimages/Images/2018/04/Gaia_s_Hertzsprung-Russell_diagram |
| 作者 | European Space Agency |
| 授權許可 (重用此檔案) |
ESA/Gaia/DPAC,CC BY-SA 3.0 IGO |
| Title | Gaia’s Hertzsprung-Russell diagram |
| Mission | Gaia |
| Activity | Space Science |
授權條款
[編輯]
- 您可以自由:
- 分享 – 複製、發佈和傳播本作品
- 重新修改 – 創作演繹作品
- 惟需遵照下列條件:
- 姓名標示 – 您必須指名出正確的製作者,和提供授權條款的連結,以及表示是否有對內容上做出變更。您可以用任何合理的方式來行動,但不得以任何方式表明授權條款是對您許可或是由您所使用。
- 相同方式分享 – 如果您利用本素材進行再混合、轉換或創作,您必須基於如同原先的相同或兼容的條款,來分布您的貢獻成品。
檔案歷史
點選日期/時間以檢視該時間的檔案版本。
| 日期/時間 | 縮圖 | 尺寸 | 用戶 | 備註 | |
|---|---|---|---|---|---|
| 目前 | 2019年4月3日 (三) 14:05 | | 2,480 × 3,754(1.46 MB) | Fæ(對話 | 貢獻) | European Space Agency, Id 393151, http://www.esa.int/spaceinimages/Images/2018/04/Gaia_s_Hertzsprung-Russell_diagram, User:Fæ/Project_list/ESA |
無法覆蓋此檔案。
檔案用途
沒有使用此檔案的頁面。
全域檔案使用狀況
以下其他 wiki 使用了這個檔案:
- ar.wikipedia.org 的使用狀況
- de.wikipedia.org 的使用狀況
- en.wikipedia.org 的使用狀況
- fr.wikipedia.org 的使用狀況
- ru.wikipedia.org 的使用狀況
- uk.wikipedia.org 的使用狀況
- zh.wikipedia.org 的使用狀況