File:Gaussianprocess SensorCalibrationCurvesMean.svg
Jump to navigation
Jump to search

Size of this PNG preview of this SVG file: 306 × 230 pixels. Other resolutions: 319 × 240 pixels | 639 × 480 pixels | 1,022 × 768 pixels | 1,280 × 962 pixels | 2,560 × 1,924 pixels.
Original file (SVG file, nominally 306 × 230 pixels, file size: 27 KB)
Captions
Captions
Add a one-line explanation of what this file represents
Summary
[edit]
| Description |
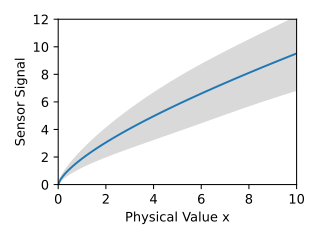
Deutsch: Mean and standard deviation of sample set |
| Date | |
| Source | Own work |
| Author | Physikinger |
| SVG development | This plot was created with Matplotlib. |
| Source code | Python code#This source code is public domain
#Author: Christian Schirm
import numpy, scipy.spatial
import matplotlib.pyplot as plt
numpy.random.seed(1)
def covMat(x1, x2, covFunc, noise=0): # Covariance matrix
cov = covFunc(scipy.spatial.distance_matrix(numpy.atleast_2d(x1).T, numpy.atleast_2d(x2).T))
if noise: cov += numpy.diag(numpy.ones(len(cov))*noise)
return cov
N=15
x = numpy.linspace(0, 10, 100)
y = [4*x**.7*(0.3+0.4*numpy.random.rand()) + (numpy.random.rand()-0.5)*2.8*numpy.sin(0.3*x*(1+0.05*numpy.random.rand())) for i in range(N)]
fig = plt.figure(figsize=(4.*0.85,3*0.85),dpi=100)
for i,iy in enumerate(y): plt.plot(x,iy,color=plt.cm.tab10(i*1./N))
plt.xlabel(u'Physical Value x')
plt.ylabel('Sensor Signal')
plt.axis([0,10,0,12])
plt.tight_layout()
plt.savefig('Gaussianprocess_SensorCalibrationCurves.svg')
A = numpy.array(y)
m = numpy.mean(A,axis=0)
cov = (A-m).T.dot((A-m))/(len(A)-1)
sigma = numpy.sqrt(cov.diagonal())
fig = plt.figure(figsize=(4.*0.85,3*0.85),dpi=100)
plt.fill_between(x, m - sigma, m + sigma, color = '0.85')
plt.plot(x,m,'-')
plt.xlabel(u'Physical Value x')
plt.ylabel('Sensor Signal')
plt.axis([0,10,0,12])
plt.tight_layout()
plt.savefig('Gaussianprocess_SensorCalibrationCurvesMean.svg')
iTest = numpy.array([45, 95])
yTest = m[iTest] + [+0.5,+2]
mask = numpy.zeros(len(cov),'bool')
mask[iTest[-1:]] = True
Ckk = cov[mask][:,mask]
Cuu = cov
numpy.fill_diagonal(Cuu,numpy.diag(Cuu)+0.000001)
CkkInv = numpy.linalg.inv(Ckk)
Cuk = cov[:,mask]
yPred = m + numpy.dot(numpy.dot(Cuk,CkkInv), yTest[-1:] - m[mask])
sigma = numpy.sqrt(numpy.maximum(0,numpy.diag(Cuu - numpy.dot(numpy.dot(Cuk,CkkInv),Cuk.T))))
fig = plt.figure(figsize=(4.*0.85,3*0.85),dpi=100)
plt.fill_between(x, yPred - sigma, yPred + sigma, color = '0.85')
plt.plot(x,yPred,'-')
plt.plot(x[mask],yTest[-1:],'ko')
plt.xlabel(u'Physical Value x')
plt.ylabel('Sensor Signal')
plt.axis([0,10,0,12])
plt.tight_layout()
plt.savefig('Gaussianprocess_SensorCalibration1Point.svg')
mask = numpy.zeros(len(cov),'bool')
mask[iTest] = True
Ckk = cov[mask][:,mask]
Cuu = cov
numpy.fill_diagonal(Cuu,numpy.diag(Cuu)+0.000001)
CkkInv = numpy.linalg.inv(Ckk)
Cuk = cov[:][:,mask]
yPred = m + numpy.dot(numpy.dot(Cuk,CkkInv), yTest - m[mask])
sigma = numpy.sqrt(numpy.maximum(0,numpy.diag(Cuu - numpy.dot(numpy.dot(Cuk,CkkInv),Cuk.T))))
fig = plt.figure(figsize=(4.*0.85,3*0.85),dpi=100)
plt.fill_between(x, yPred - sigma, yPred + sigma, color = '0.85')
plt.plot(x,yPred,'-')
plt.plot(x[mask],yTest,'ko')
plt.xlabel(u'Physical Value x')
plt.ylabel('Sensor Signal')
plt.axis([0,10,0,12])
plt.tight_layout()
plt.savefig('Gaussianprocess_SensorCalibration2Point.svg')
|
Licensing
[edit]
I, the copyright holder of this work, hereby publish it under the following license:
| This file is made available under the Creative Commons CC0 1.0 Universal Public Domain Dedication. | |
| The person who associated a work with this deed has dedicated the work to the public domain by waiving all of their rights to the work worldwide under copyright law, including all related and neighboring rights, to the extent allowed by law. You can copy, modify, distribute and perform the work, even for commercial purposes, all without asking permission.
|
File history
Click on a date/time to view the file as it appeared at that time.
| Date/Time | Thumbnail | Dimensions | User | Comment | |
|---|---|---|---|---|---|
| current | 21:26, 23 March 2023 | | 306 × 230 (27 KB) | Physikinger (talk | contribs) | English |
| 22:05, 4 March 2018 |  | 305 × 228 (31 KB) | Physikinger (talk | contribs) | Sensor with saturation | |
| 19:43, 2 March 2018 |  | 305 × 228 (30 KB) | Physikinger (talk | contribs) | new | |
| 19:34, 2 March 2018 |  | 305 × 229 (30 KB) | Physikinger (talk | contribs) | points | |
| 23:36, 1 March 2018 |  | 305 × 229 (30 KB) | Physikinger (talk | contribs) | label | |
| 21:48, 1 March 2018 |  | 288 × 215 (30 KB) | Physikinger (talk | contribs) | User created page with UploadWizard |
You cannot overwrite this file.
File usage on Commons
There are no pages that use this file.
File usage on other wikis
The following other wikis use this file:
- Usage on de.wikipedia.org
- Usage on en.wikibooks.org