File:Ginger 1971 rainfall.gif
跳转到导航
跳转到搜索

本预览的尺寸:653 × 600像素。 其他分辨率:261 × 240像素 | 523 × 480像素 | 836 × 768像素 | 1,069 × 982像素。
原始文件 (1,069 × 982像素,文件大小:31 KB,MIME类型:image/gif)
说明
说明
添加一行文字以描述该文件所表现的内容
摘要
| 描述 |
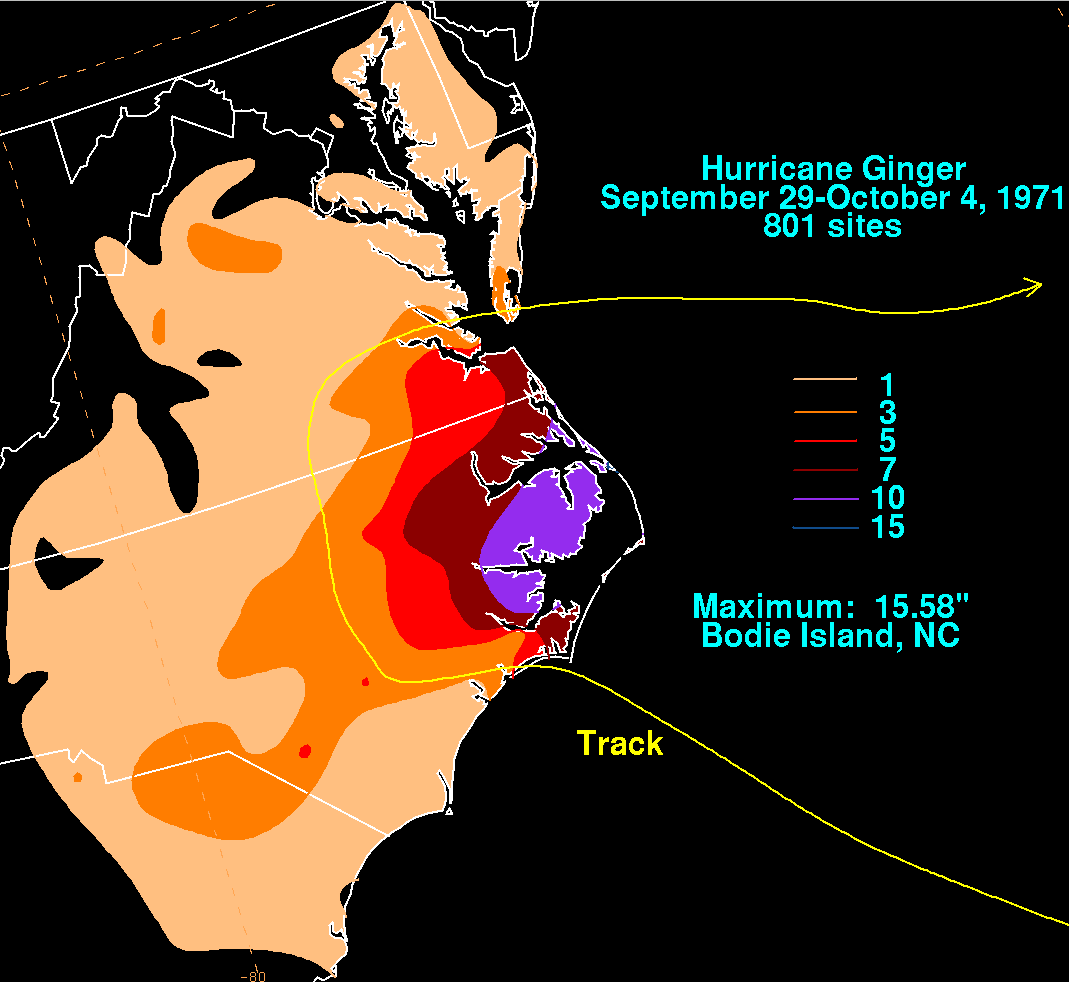
English: Storm total rainfall map of Hurricane Ginger during September and October 1971. |
|||
| 日期 | ||||
| 来源 | WPC tropical cyclone rainfall data | |||
| 作者 | David Roth, Weather Prediction Center, Camp Springs, Maryland | |||
| 授权 (二次使用本文件) |
|
文件历史
点击某个日期/时间查看对应时刻的文件。
| 日期/时间 | 缩略图 | 大小 | 用户 | 备注 | |
|---|---|---|---|---|---|
| 当前 | 2011年4月3日 (日) 15:09 | | 1,069 × 982(31 KB) | Hurricanehink(留言 | 贡献) | {{Information |Description ={{en|1=A tropical depression formed on September 5th, near an upper level low. The cyclone drifted for 4-5 days before developing into a tropical storm by the 10th. The cyclone moved east to northeast through the 13th whil |
您不可以覆盖此文件。
文件用途
以下页面使用本文件:
全域文件用途
以下其他wiki使用此文件:
- en.wikipedia.org上的用途
- es.wikipedia.org上的用途
- zh.wikipedia.org上的用途