File:HATS Nitrous Oxide concentration.png
跳转到导航
跳转到搜索
没有更高的分辨率。
HATS_Nitrous_Oxide_concentration.png (695 × 406像素,文件大小:57 KB,MIME类型:image/png)
说明
说明
添加一行文字以描述该文件所表现的内容
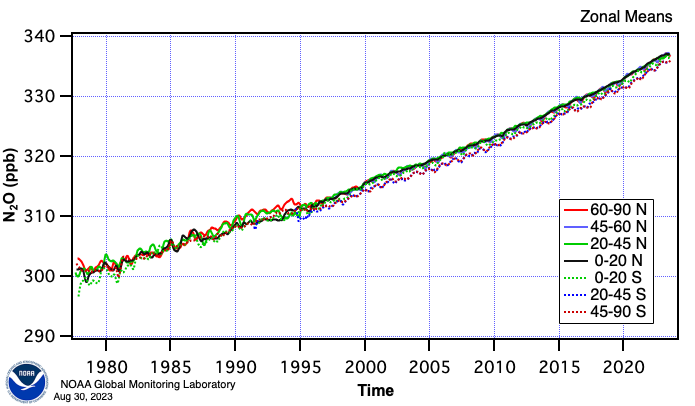
Growth in Nitrous Oxide atmospheric concentration since year 1978
摘要
[编辑]
| 描述 |
English: Graph shows the concentration of nitrous oxide ( N2O) in earth's atmosphere versus time and latitude. X-axis data interval is monthly. Y-axis concentration is parts per billion. Atmospheric samples were gathered within evacuated flasks from 8-12 ground stations distributed over the northern (positive latitudes) and southern hemispheres, then sealed and transported to Boulder Colorado for analysis. Most emissions originate at northern latitudes, and are mixed through the troposphere of both hemispheres after about 1-2 years. Data sampling and analysis by: |
| 日期 | |
| 来源 | https://www.esrl.noaa.gov/gmd/hats/combined/N2O.html |
| 作者 | NOAA |
许可协议
[编辑]
本图像属于公有领域,因该作品最初来自于美国国家海洋和大气管理局职员的职务作品。
|
文件历史
点击某个日期/时间查看对应时刻的文件。
| 日期/时间 | 缩略图 | 大小 | 用户 | 备注 | |
|---|---|---|---|---|---|
| 当前 | 2024年2月9日 (五) 01:50 | | 695 × 406(57 KB) | Bikesrcool(留言 | 贡献) | update February 2024 |
| 2021年2月8日 (一) 14:19 |  | 695 × 406(57 KB) | Bikesrcool(留言 | 贡献) | Uploaded a work by NOAA from https://www.esrl.noaa.gov/gmd/hats/combined/N2O.html with UploadWizard |
您不可以覆盖此文件。
文件用途
没有页面使用本文件。
全域文件用途
以下其他wiki使用此文件:
- en.wikipedia.org上的用途
- mk.wikipedia.org上的用途
- pt.wikipedia.org上的用途
- zh.wikipedia.org上的用途