Category:Greenhouse gases
Jump to navigation
Jump to search
gas in an atmosphere of a planet (usually Earth) that absorbs and emits radiation within the thermal infrared range and causes the greenhouse effect  | |||||
| Upload media | |||||
| Pronunciation audio | |||||
|---|---|---|---|---|---|
| Subclass of |
| ||||
| Physically interacts with | |||||
| |||||
Bahasa Indonesia: Gas rumah kaca.
Nederlands: Broeikasgassen
Subcategories
This category has the following 11 subcategories, out of 11 total.
*
A
C
E
G
M
N
O
Media in category "Greenhouse gases"
The following 103 files are in this category, out of 103 total.
-
 1979- Radiative forcing - climate change - global warming - EPA NOAA.svg 1,100 × 750; 15 KB
-
 AGAGE sulfur hexafluroride growth.png 600 × 446; 31 KB
-
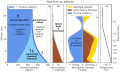 Atmospheric heat flow profile.svg 720 × 432; 129 KB
-
 Automobile exhaust gas.jpg 1,623 × 1,347; 246 KB
-
 BK HFC32.jpg 809 × 374; 50 KB
-
 BK MC.jpg 820 × 374; 44 KB
-
 Carbon dioxide infrared absorption.png 355 × 672; 74 KB
-
 Carbon Dioxide Molecular Orbitals.png 1,030 × 1,004; 142 KB
-
 Carbon tetrafluoride concentration.jpg 813 × 376; 49 KB
-
-
 Chlorofluorocarbons (space-filling representation).jpg 400 × 400; 26 KB
-
 Civil disobedience rally at Hazelwood September 2009.jpg 800 × 533; 116 KB
-

-
 Climateregistry map Dec2008.svg 1,720 × 1,780; 270 KB
-
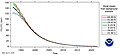
 CO2 exponential decay comparison.png 1,266 × 890; 30 KB
-

-
 COP26 Behind the Scenes (cop26 0044) (51646556556).jpg 5,474 × 3,649; 11.38 MB
-
 CSIRO ScienceImage 506 Measuring Gas Emissions and Absorption From Plants.jpg 2,524 × 1,691; 3.91 MB
-
 CSIRO ScienceImage 534 Measuring Gas Emissions and Absorption From Wheat.jpg 2,508 × 1,692; 4.45 MB
-
 CSIRO ScienceImage 606 Anaysing Car Exhaust Gasses.jpg 2,564 × 1,667; 4.71 MB
-
De-Klimagas.ogg 1.9 s; 19 KB
-
 Earth On Stove.png 4,096 × 4,096; 8.5 MB
-
-
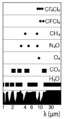 Espectro-IR-invernadero.png 510 × 947; 8 KB
-
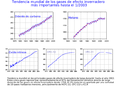
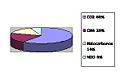
 Gases de efecto invernadero.es.png 623 × 412; 49 KB
-
 Gases de efecto invernadero.png 640 × 480; 48 KB
-
 GHGと土地利用.png 1,906 × 1,406; 267 KB
-
 GHG排出量と濃度.png 2,160 × 1,250; 301 KB
-
 GHG放出源と吸収源.png 2,604 × 2,708; 330 KB
-
 Global climate forcing of the industrial era.png 867 × 639; 73 KB
-
 Global Warming Feedback Loops.PNG 1,380 × 1,942; 86 KB
-
 GMCdiagram.jpg 1,506 × 687; 264 KB
-
 Granulos.jpg 1,392 × 1,040; 93 KB
-
 Greenhouse Effect and Ozone Hole.tif 3,000 × 2,250; 1.66 MB
-
 Greenhouse gas radiative forcing growth since 1979.svg 992 × 744; 82 KB
-
 Greenhouse gas summary.PNG 1,762 × 1,254; 39 KB
-
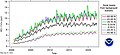
 Greenhouse gases seasonal cycles.jpg 762 × 803; 188 KB
-
 Greenhouse Gases.jpg 705 × 482; 138 KB
-
 Greenhouse gases.svg 1,440 × 900; 100 KB
-
 Greenhouses gases.JPG 512 × 384; 24 KB
-
 Gwp glass.gif 1,020 × 267; 35 KB
-
 Halogenated gas concentrations 1978-present.png 928 × 598; 24 KB
-
 Hats ccl4 global.png 695 × 406; 57 KB
-
 Hats f113 global.png 695 × 405; 37 KB
-
 Hats f12 global.png 695 × 405; 40 KB
-
 HATS Nitrous Oxide concentration.png 695 × 406; 57 KB
-
 HATS Nitrous Oxide growth rate.png 695 × 385; 43 KB
-
 HCFC and HFC atmospheric trends.png 1,094 × 1,138; 245 KB
-
 HCFC141b concentration.jpg 809 × 374; 52 KB
-
 HCFC142b concentration.jpg 809 × 374; 51 KB
-
 HCFC22 concentration.jpg 818 × 374; 53 KB
-
 Hexafluoroethane concentration.jpg 818 × 374; 57 KB
-
 HFC125 concentration.jpg 809 × 374; 49 KB
-
 HFC143a concentration.jpg 809 × 374; 51 KB
-
 HFC152a concentration.jpg 809 × 374; 69 KB
-
-
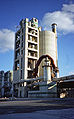 LDCement2StringPH.jpg 1,115 × 1,800; 573 KB
-
 LDCementXRDOnline.JPG 1,752 × 1,170; 262 KB
-
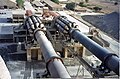 LDSatelliteCooler.jpg 1,154 × 762; 706 KB
-
 Life Cycle Climate Performance Components.jpg 1,280 × 720; 108 KB
-
 Logo Alpine Convention.jpg 2,349 × 1,197; 191 KB
-
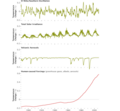
 Major greenhouse gas trends.png 1,020 × 668; 88 KB
-
 Many-layered atmospheric model.png 800 × 800; 44 KB
-
 Mauna Loa HFC-134a (CH2FCF3) concentration.png 1,200 × 900; 112 KB
-
 Mauna Loa Sulfur Hexafluoride concentration.jpg 1,200 × 900; 133 KB
-
 Mauna Loa Tetrafluoromethane.jpg 1,051 × 791; 259 KB
-
 NACementKilns%Wet.jpg 593 × 393; 74 KB
-
 NACementKilnsMeanFuel.jpg 593 × 393; 85 KB
-
 NACementKilnsMeanFuel.png 590 × 390; 27 KB
-
 NACementKilnsMeanTPD.jpg 593 × 393; 69 KB
-
 NACementKilnsMeanTPD.png 590 × 390; 7 KB
-
 NACementKilnsPercentPC.jpg 479 × 435; 55 KB
-
 NACementKilnsPercentPC.png 467 × 424; 14 KB
-
 NACementKilnsPercentWet.png 590 × 390; 2 KB
-
 Nitrogen Trifluoride concentration.jpg 820 × 374; 50 KB
-
 NOAA Annual Greenhouse Gas Index 2012.png 780 × 530; 48 KB
-
 NOAA-greenhouse-gases-till-2006.png 831 × 624; 36 KB
-
 NTE Zone graphic 2.JPG 576 × 467; 33 KB
-
 NTE Zone graphic.JPG 576 × 394; 92 KB
-
 Ozone cfc trends.png 1,096 × 1,271; 123 KB
-
 Perfluorotributylamine-global-warming-potential.jpg 800 × 856; 55 KB
-
 Plantationpre.jpg 1,280 × 853; 513 KB
-
 Radiative forcing on the global climate between 1750 and 2005.png 1,374 × 924; 479 KB
-
 REDD forest related activities.jpg 1,200 × 811; 135 KB
-
 Refrigerants-Prices-Wikipedia-2016-08-25.svg 639 × 787; 155 KB
-
 Solar radiation and greenhouse gas.png 819 × 460; 17 KB
-
 Sulfur Hexafluoride concentration.png 695 × 406; 51 KB
-
 Sulfuryl fluoride concentration.jpg 822 × 376; 54 KB
-
 Tetrafluoromethane concentration.jpg 811 × 374; 49 KB
-
 Zero Emission.jpg 365 × 217; 35 KB
-
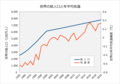 世界の総人口と年平均気温.png 2,433 × 1,704; 166 KB
-
 世界平均放射強制力.png 1,354 × 1,354; 103 KB
-
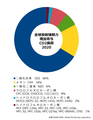
 世界部門別GHG排出内訳.png 1,333 × 1,354; 104 KB
-
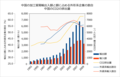 中国の加工貿易輸出入額とCO2排出量.png 2,443 × 1,573; 165 KB
-
 二酸化炭素の赤外線の吸収と放出.png 1,338 × 1,659; 73 KB
-
 全球放射強制力2020.png 729 × 937; 50 KB
-
 化石燃料とGHGの増加率.png 2,249 × 1,918; 665 KB
-
 太陽活動と気温の変化.png 1,080 × 859; 95 KB
-
 家畜とメタンの増加率.png 2,188 × 2,500; 671 KB
-
 日本GHG各物質割合.png 729 × 937; 50 KB
-
 日本のGHG吸排出一覧.png 1,979 × 3,250; 467 KB
-
 近年の二酸化炭素と気温の変化.png 664 × 586; 59 KB
-
 過去80万年の二酸化炭素・公転軌道の離心率・気温の変化.png 914 × 534; 63 KB


.jpg)

._Atmospheric_greenhouse_gas_concentrations_2000-2100.png)


_(51646556556).jpg)


.png)


_concentration.png)


