File:Haplogroup Q (Y-DNA).PNG
跳转到导航
跳转到搜索
本预览的尺寸:800 × 410像素。 其他分辨率:320 × 164像素 | 831 × 426像素。
原始文件 (831 × 426像素,文件大小:32 KB,MIME类型:image/png)
说明
说明
添加一行文字以描述该文件所表现的内容
摘要
[编辑].PNG&action=edit§ion=1)
| 描述 |
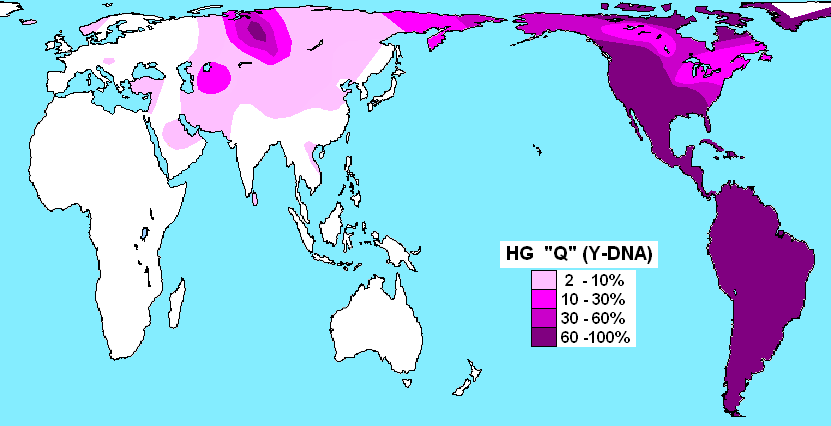
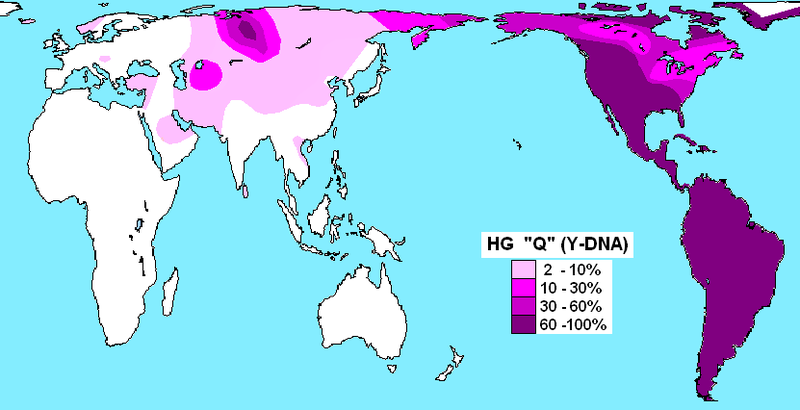
English: Haplogroup Q (Y-DNA) distribution.
Español: distribución del haplogrupo Q (ADN-Y) en poblaciones nativas. |
| 日期 | |
| 来源 | 自己的作品 |
| 作者 | Maulucioni |
| 授权 (二次使用本文件) |
Trabajo propio / Own. |
Referencias
[编辑].PNG&action=edit§ion=2)
Para América, basado en Bortoloni 2003, Zegura 2004, Bolnick 2006 y Malhi 2008. (Ver Y-DNA haplogroups in Indigenous peoples of the Americas)
许可协议
[编辑].PNG&action=edit§ion=3)
我,本作品著作权人,特此采用以下许可协议发表本作品:

|
已授权您依据自由软件基金会发行的无固定段落及封面封底文字(Invariant Sections, Front-Cover Texts, and Back-Cover Texts)的GNU自由文件许可协议1.2版或任意后续版本的条款,复制、传播和/或修改本文件。该协议的副本请见“GNU Free Documentation License”。 |
本文件采用知识共享署名 3.0 未本地化版本许可协议授权。
- 您可以自由地:
- 共享 – 复制、发行并传播本作品
- 修改 – 改编作品
- 惟须遵守下列条件:
- 署名 – 您必须对作品进行署名,提供授权条款的链接,并说明是否对原始内容进行了更改。您可以用任何合理的方式来署名,但不得以任何方式表明许可人认可您或您的使用。
您可以选择您需要的许可协议。
文件历史
点击某个日期/时间查看对应时刻的文件。
.PNG&uselang=zh-sg&dir=prev)
.PNG&uselang=zh-sg&offset=20191128201737)
.PNG&uselang=zh-sg&offset=&limit=20)
.PNG&uselang=zh-sg&offset=&limit=50)
.PNG&uselang=zh-sg&offset=&limit=100)
.PNG&uselang=zh-sg&offset=&limit=250)
.PNG&uselang=zh-sg&offset=&limit=500)
| 日期/时间 | 缩略图 | 大小 | 用户 | 备注 | |
|---|---|---|---|---|---|
| 当前 | 2020年10月11日 (日) 12:31 | | 831 × 426(32 KB) | Maulucioni(留言 | 贡献) | Data for East Asia and Southeast Asia are overestimated. Reverted to version as of 05:04, 9 December 2011 (UTC) |
| 2020年5月16日 (六) 22:07 |  | 831 × 426(32 KB) | Satoshi Kondo(留言 | 贡献) | Reverted to version as of 02:30, 5 April 2020 (UTC) | |
| 2020年5月16日 (六) 15:55 |  | 831 × 426(31 KB) | SahinCcC(留言 | 贡献) | Reverted to version as of 22:41, 2 April 2020 (UTC) corrected wrong edit | |
| 2020年4月5日 (日) 02:30 |  | 831 × 426(32 KB) | SahinCcC(留言 | 贡献) | Reverted to version as of 01:51, 18 February 2020 (UTC) | |
| 2020年4月2日 (四) 22:41 |  | 831 × 426(31 KB) | SahinCcC(留言 | 贡献) | corrected Turkmen and Uyghur samples based on paternal lineages 30% to 60% in ethnic Turkmens | |
| 2020年2月18日 (二) 01:51 |  | 831 × 426(32 KB) | Ilber8000(留言 | 贡献) | India update : South India update from Arunkumar et al. 2012, varies between 7%-1% from Table 2, and North India/Western India G. Mahal et al. (2017) - Highest in Jats at 15.6%, they give 4.2% average for all South Asia from Table 2. | |
| 2020年2月18日 (二) 01:45 |  | 831 × 426(32 KB) | Ilber8000(留言 | 贡献) | Will update again with additonal source | |
| 2020年2月18日 (二) 01:11 |  | 831 × 426(32 KB) | Ilber8000(留言 | 贡献) | South India update from Arunkumar et al. 2012, varies between 7%-1% from Table 2. | |
| 2019年12月22日 (日) 20:13 |  | 831 × 426(32 KB) | LenguaMapa(留言 | 贡献) | minor correction in southwestern india | |
| 2019年11月28日 (四) 20:17 |  | 831 × 426(32 KB) | LenguaMapa(留言 | 贡献) | further minor correction on India and Southeast Asia (Akha tribes etc.) |
您不可以覆盖此文件。
文件用途
全域文件用途
以下其他wiki使用此文件:
- ast.wikipedia.org上的用途
- azb.wikipedia.org上的用途
- ca.wikipedia.org上的用途
- es.wikipedia.org上的用途
- fi.wikipedia.org上的用途
- fr.wikipedia.org上的用途
- hi.wikipedia.org上的用途
- ja.wikipedia.org上的用途
- ru.wikipedia.org上的用途
- tr.wikipedia.org上的用途
- zh.wikipedia.org上的用途
.PNG&oldid=723641600)