File:ICC-example1.svg
Jump to navigation
Jump to search

Size of this PNG preview of this SVG file: 720 × 540 pixels. Other resolutions: 320 × 240 pixels | 640 × 480 pixels | 1,024 × 768 pixels | 1,280 × 960 pixels | 2,560 × 1,920 pixels.
Original file (SVG file, nominally 720 × 540 pixels, file size: 52 KB)
Captions
Captions
Add a one-line explanation of what this file represents
Summary
[edit]
| Description |
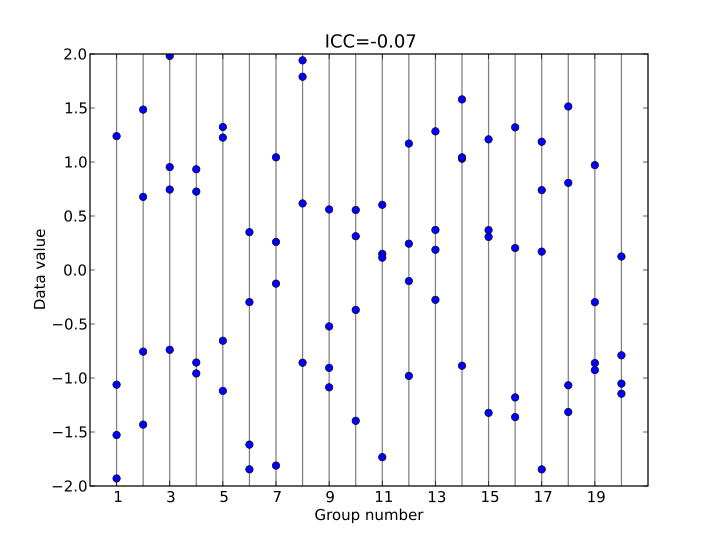
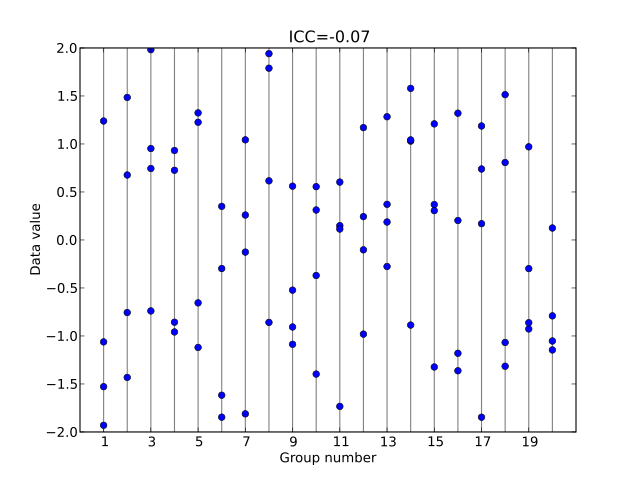
English: Dot plot illustrating the intraclass correlation coefficient |
| Date | |
| Source |
Own work |
| Author | Skbkekas |
| SVG development | This plot was created with Matplotlib. |
| Source code | Python codefrom __future__ import division
import numpy as np
import matplotlib.pyplot as plt
def ICC(X):
K = X.shape[1]
m = X.mean(1)-X.mean()
A = (m**2).mean()/X.var()
A *= K/(K-1)
A -= 1/(K-1)
return A
def genplot(X, fname):
n = X.shape[0]
plt.clf()
for i in range(1,n+1):
plt.plot((i,i), (-2,2), '-', color='grey')
plt.hold(True)
for k in range(X.shape[1]):
plt.plot(np.arange(1,n+1), X[:,k], 'o', color='blue')
plt.xlim(0,n+1)
plt.xlabel("Group number")
plt.ylabel("Data value")
icc = ICC(X)
plt.title("ICC=%.2f" % icc)
plt.xticks(range(1,n+1,2))
plt.savefig(fname + ".png")
plt.savefig(fname + ".svg")
X = np.random.uniform(low=-2, high=2, size=(20,4))
genplot(X, "ICC-example1")
V = np.random.uniform(low=-2, high=2, size=20)
X = np.zeros((20,4))
for i in range(len(V)):
e = min(min(V[i]+2,2-V[i]),0.7)
X[i,:] = np.random.uniform(low=V[i]-e, high=V[i]+e, size=4)
genplot(X, "ICC-example2")
|
Licensing
[edit]
I, the copyright holder of this work, hereby publish it under the following licenses:

|
Permission is granted to copy, distribute and/or modify this document under the terms of the GNU Free Documentation License, Version 1.2 or any later version published by the Free Software Foundation; with no Invariant Sections, no Front-Cover Texts, and no Back-Cover Texts. A copy of the license is included in the section entitled GNU Free Documentation License. |
| This file is licensed under the Creative Commons Attribution-Share Alike 3.0 Unported license. | ||
| ||
| This licensing tag was added to this file as part of the GFDL licensing update. |
| Copyleft: This work of art is free; you can redistribute it and/or modify it according to terms of the Free Art License. You will find a specimen of this license on the Copyleft Attitude site as well as on other sites. |
You may select the license of your choice.
File history
Click on a date/time to view the file as it appeared at that time.
| Date/Time | Thumbnail | Dimensions | User | Comment | |
|---|---|---|---|---|---|
| current | 19:58, 9 June 2009 | | 720 × 540 (52 KB) | Skbkekas (talk | contribs) | {{Information |Description={{en|1=Dot plot illustrating the intraclass correlation coefficient}} |Source=Own work by uploader |Author=Skbkekas |Date=2009-06-09 |Permission= |other_versions= }} <!--{{ImageUpload|full}}--> [[Category:Stat |
You cannot overwrite this file.
File usage on Commons
There are no pages that use this file.
File usage on other wikis
The following other wikis use this file:
- Usage on cy.wikipedia.org
- Usage on en.wikipedia.org
- Usage on fa.wikipedia.org
- Usage on ml.wikipedia.org
- Usage on zh-yue.wikipedia.org
- Usage on zh.wikipedia.org