File:Ineffective Price Floor.svg
跳转到导航
跳转到搜索

此SVG文件的PNG预览的大小:400 × 400像素。 其他分辨率:240 × 240像素 | 480 × 480像素 | 768 × 768像素 | 1,024 × 1,024像素 | 2,048 × 2,048像素。
原始文件 (SVG文件,尺寸为400 × 400像素,文件大小:7 KB)
说明
说明
添加一行文字以描述该文件所表现的内容
摘要[编辑]
| 描述 |
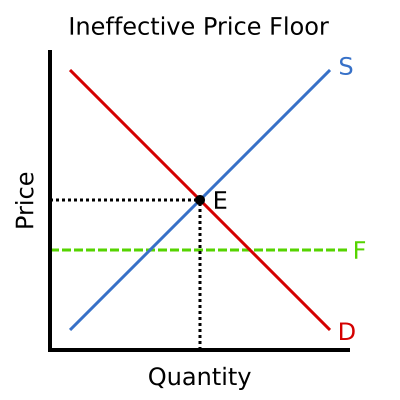
English: An illustrative supply/demand graph, showing an ineffective price floor (below equilibrium price). Line D (red) represents the demand (price vs. quantity demanded), line S (blue) represents the supply (price vs. quantity supplied), point E (black) is the equilibrium point, and line F (green, dashed) represents the price floor. |
||
| 日期 | |||
| 来源 | Own work, based on Image:Basic price floor.png | ||
| 作者 | Kbolino (talk) | ||
| 授权 (二次使用本文件) |
|
原始上传日志[编辑]
原始描述頁面位於這裡。下列使用者名稱均來自en.wikipedia。
- 2008-09-14 08:09 Kbolino 400×400× (7670 bytes) {{Information |Description=An illustrative supply/demand curve, showing an ineffective price floor (below equilibrium price). |Source=Own work, based on [[Image:Basic price floor.png]] |Date=14 September 2008 |Author=~~~ |other_versions= }}
文件历史
点击某个日期/时间查看对应时刻的文件。
| 日期/时间 | 缩略图 | 大小 | 用户 | 备注 | |
|---|---|---|---|---|---|
| 当前 | 2014年3月17日 (一) 09:48 | | 400 × 400(7 KB) | Wolfch(留言 | 贡献) | {{Information |Description=An illustrative supply/demand graph, showing an ineffective price floor (below equilibrium price). Line D (red) represents the demand (price vs. quantity demanded), line S (blue) represents the supply (price vs. quantity supp... |
您不可以覆盖此文件。
文件用途
没有页面使用本文件。
全域文件用途
以下其他wiki使用此文件:
- el.wikipedia.org上的用途
- en.wikipedia.org上的用途
- et.wikipedia.org上的用途
- zh.wikipedia.org上的用途