File:Landkreis Wunsiedel im Fichtelgebirge Bevoelkerungsentwicklung.svg
Jump to navigation
Jump to search

Size of this PNG preview of this SVG file: 800 × 400 pixels. Other resolutions: 320 × 160 pixels | 640 × 320 pixels | 1,024 × 512 pixels | 1,280 × 640 pixels | 2,560 × 1,280 pixels.
Original file (SVG file, nominally 800 × 400 pixels, file size: 30 KB)
Captions
Captions
Add a one-line explanation of what this file represents
Summary
[edit]
| Description |
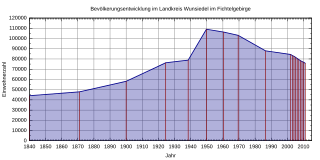
Deutsch: Bevölkerungsentwicklung des Landkreises Wunsiedel im Fichtelgebirge. Graphik nach "Bayerisches Landesamt fuer Statistik: Statistik kommunal 2012 ‒ Eine Auswahl wichtiger statistischer Daten fuer den Landkreis Wunsiedel im Fichtelgebirge.". |
| Date | |
| Source | Own work |
| Author | Michael Fiedler |
Licensing
[edit]
I, the copyright holder of this work, hereby publish it under the following license:
This file is licensed under the Creative Commons Attribution-Share Alike 3.0 Unported license.
- You are free:
- to share – to copy, distribute and transmit the work
- to remix – to adapt the work
- Under the following conditions:
- attribution – You must give appropriate credit, provide a link to the license, and indicate if changes were made. You may do so in any reasonable manner, but not in any way that suggests the licensor endorses you or your use.
- share alike – If you remix, transform, or build upon the material, you must distribute your contributions under the same or compatible license as the original.
Gnuplot script to generate this plot
[edit]
#!/usr/bin/gnuplot
# gnuplot 4.6 / Debian 7
#
# Graphik nach "Bayerisches Landesamt fuer Statistik: Statistik kommunal 2012 -
# Eine Auswahl wichtiger statistischer Daten fuer den Landkreis Wunsiedel im
# Fichtelgebirge.", https://www.statistik.bayern.de/statistikkommunal/09479.pdf
#
# Erstellt von Michael Fiedler <michael.fiedler87@gmx.de>
# Lizenz: CC-BY-SA 3.0 unported, https://creativecommons.org/licenses/by-sa/3.0/deed.de
# Basierend auf http://commons.wikimedia.org/wiki/File:Muc_population.svg von Gorgo

# input
set timefmt "%d.%m.%Y"
set datafile separator ";"

# output
set title 'Bevölkerungsentwicklung im Landkreis Wunsiedel im Fichtelgebirge'
unset key
set style fill transparent solid 0.3
set grid

set xdata time
set xlabel 'Jahr'
set xrange ['01.12.1840':'31.12.2015']
# Jahreszahl alle 10 Jahre (Beginn,Erhoehung in 10 Sekunden,Ende)
# Der Zahlenwert entspricht einem Jahr mit 365,25 Tagen
set xtics '01.12.1840',315576000,'31.12.2015'
# Zehnjahresintervall in 9 Intervalle unterteilt (jedes Jahr eine Markierung)
set mxtics 10
set format x '%Y'

set ylabel 'Einwohnerzahl'
# Beschriftungsintervall
set ytics 10000
# weitere Unterteilung ohne Beschriftung
set mytics 2
set yrange ['0':'120000']
set format y '%.0f'


set terminal svg size 800,400 font 'Arial,10'
set output 'Landkreis_Wunsiedel_im_Fichtelgebirge_Bevoelkerungsentwicklung.svg'

# '-' nimmt die nachfolgenden Daten als Eingabewerte
plot '-' using 1:($2) with filledcurves below x1 linetype rgb 'dark-blue' linewidth 2, \
	    '-' using 1:($2) with impulses linecolor rgbcolor 'dark-red' linewidth 1.5
	01.12.1840;44111
	01.12.1871;47841
	01.12.1900;58166
	16.06.1925;76291
	17.05.1939;78864
	13.09.1950;109049
	06.06.1961;106266
	27.05.1970;103056
	25.05.1987;87941
	31.12.2002;84391
	31.12.2003;83365
	31.12.2004;82627
	31.12.2005;81631
	31.12.2006;80505
	31.12.2007;79433
	31.12.2008;78439
	31.12.2009;77486
	31.12.2010;76848
	31.12.2011;75782
EOF
File history
Click on a date/time to view the file as it appeared at that time.
| Date/Time | Thumbnail | Dimensions | User | Comment | |
|---|---|---|---|---|---|
| current | 09:44, 23 March 2014 | | 800 × 400 (30 KB) | Simified (talk | contribs) | fix mxtics |
| 05:11, 23 March 2014 |  | 800 × 400 (29 KB) | Simified (talk | contribs) | User created page with UploadWizard |
You cannot overwrite this file.
File usage on Commons
There are no pages that use this file.
File usage on other wikis
The following other wikis use this file:
- Usage on de.wikipedia.org
- Usage on nl.wikipedia.org