File:Linear least squares example2.svg
跳至導覽
跳至搜尋

此 SVG 檔案的 PNG 預覽的大小:279 × 274 像素。 其他解析度:244 × 240 像素 | 489 × 480 像素 | 782 × 768 像素 | 1,043 × 1,024 像素 | 2,085 × 2,048 像素。
原始檔案 (SVG 檔案,表面大小:279 × 274 像素,檔案大小:50 KB)
說明
說明
添加單行說明來描述出檔案所代表的內容
摘要
[編輯]
| 描述 |
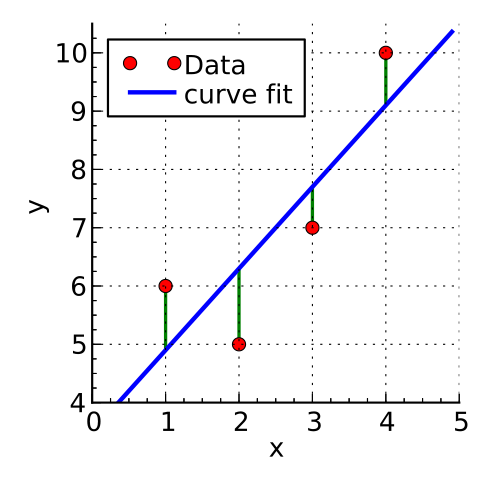
English: Illustration of least squares fitting. The data (red dots) are at co-ordinates (1,6), (2,5), (3,7) and (4,10). A linear approximation is obtained using least-squares estimation (blue line). Created using python. |
| 日期 | |
| 來源 | 自己的作品 |
| 作者 | Krishnavedala |
| 其他版本 |
File:Linear_least_squares_example2.png Derivative works of this file: |
W3C-validity not checked.
Source Code
|
|---|
from matplotlib.pyplot import *
from numpy import *
from mpl_toolkits.axisartist import *

x,y = [1.,2.,3.,4.], [6., 5., 7., 10.]
A = vstack([x, ones(len(x))]).T
b2,b1 = linalg.lstsq(A,y)[0]
x2 = arange(0,5,0.1)
y2 = lambda xx: b1+b2*xx

fig = figure(figsize=(3,3))
ax = Subplot(fig,"111",axisbg='none')
fig.add_subplot(ax)
ax.axis["right"].set_visible(False)
ax.axis["top"].set_visible(False)
ax.plot(x,y,'ro',label="Data")
ax.plot(x2,y2(x2),label="curve fit",lw=2)
ymin, ymax = [], []
for i in range(len(x)):
	yy = y2(x[i])
	if yy >= y[i]:
		ymin, ymax = append(ymin,y[i]), append(ymax,yy)
	else:
		ymin, ymax = append(ymax,yy), append(ymin,y[i])
ax.vlines(x,ymin, ymax,color='g',linestyles='solid',lw=1.5)
ax.set_ylabel("y",fontsize=12)
ax.set_xlabel("x",fontsize=12)
ax.grid(True)
ax.minorticks_on()
ax.set_xlim(0,5)
ax.set_ylim(4,10.5)
ax.legend(frameon=True, handletextpad=0,loc='upper left',\
	labelspacing=.05)
setp(ax.get_legend().get_texts(),fontsize=12)

fig.savefig("Linear_least_squares_example2.svg",bbox_inches="tight",\
	pad_inches=.15)
|
授權條款
[編輯]
我,本作品的著作權持有者,決定用以下授權條款發佈本作品:
此檔案採用共享創意 姓名標示-相同方式分享 3.0 未在地化版本授權條款。
- 您可以自由:
- 分享 – 複製、發佈和傳播本作品
- 重新修改 – 創作演繹作品
- 惟需遵照下列條件:
- 姓名標示 – 您必須指名出正確的製作者,和提供授權條款的連結,以及表示是否有對內容上做出變更。您可以用任何合理的方式來行動,但不得以任何方式表明授權條款是對您許可或是由您所使用。
- 相同方式分享 – 如果您利用本素材進行再混合、轉換或創作,您必須基於如同原先的相同或兼容的條款,來分布您的貢獻成品。

|
已授權您依據自由軟體基金會發行的無固定段落、封面文字和封底文字GNU自由文件授權條款1.2版或任意後續版本,對本檔進行複製、傳播和/或修改。該協議的副本列在GNU自由文件授權條款中。 |
您可以選擇您需要的授權條款。
檔案歷史
點選日期/時間以檢視該時間的檔案版本。
| 日期/時間 | 縮圖 | 尺寸 | 用戶 | 備註 | |
|---|---|---|---|---|---|
| 目前 | 2011年6月10日 (五) 03:35 | | 279 × 274(50 KB) | Krishnavedala(對話 | 貢獻) | {{Information |Description ={{en|1=Illustration of w:Linear_least_squares_(mathematicsleast squares fitting. The data (red dots) are at co-ordinates (1,6), (2,5), (3,7) and (4,10). A linear approximation is obtained using least-squares estimation |
無法覆蓋此檔案。
檔案用途
下列7個頁面有用到此檔案:
- File:Linear least squares example2.png
- File:Regression lineaire abscisses.svg
- File:Regression lineaire abscisses ordonnees.svg
- File:Regression lineaire abscisses ordonnees orthogonal.svg
- File:Regression lineaire ordonnees.svg
- File:Regression lineaire ordonnees orthogonal.svg
- File:Regression lineaire orthogonal.svg
全域檔案使用狀況
以下其他 wiki 使用了這個檔案:
- ckb.wikipedia.org 的使用狀況
- da.wikipedia.org 的使用狀況
- de.wikibooks.org 的使用狀況
- Mathematrix: AT BRP/ Theorie/ Reifeniveau 6
- Mathematrix: MA TER/ Theorie/ Statistik und Wahrscheinlichkeitsrechnung
- Mathematrix: AT BRP/ Theorie nach Thema/ Statistik und Wahrscheinlichkeitsrechnung
- Mathematrix: AT AHS/ Theorie nach Thema/ Statistik und Wahrscheinlichkeitsrechnung
- Mathematrix: BY GYM/ Theorie nach Thema/ Statistik und Wahrscheinlichkeitsrechnung
- de.wikiversity.org 的使用狀況
- en.wikipedia.org 的使用狀況
- ro.wikipedia.org 的使用狀況
- uk.wikipedia.org 的使用狀況
- zh.wikipedia.org 的使用狀況