File:Linear least squares example2.svg
跳转到导航
跳转到搜索

此SVG文件的PNG预览的大小:279 × 274像素。 其他分辨率:244 × 240像素 | 489 × 480像素 | 782 × 768像素 | 1,043 × 1,024像素 | 2,085 × 2,048像素。
原始文件 (SVG文件,尺寸为279 × 274像素,文件大小:50 KB)
说明
说明
添加一行文字以描述该文件所表现的内容
摘要
[编辑]
| 描述 |
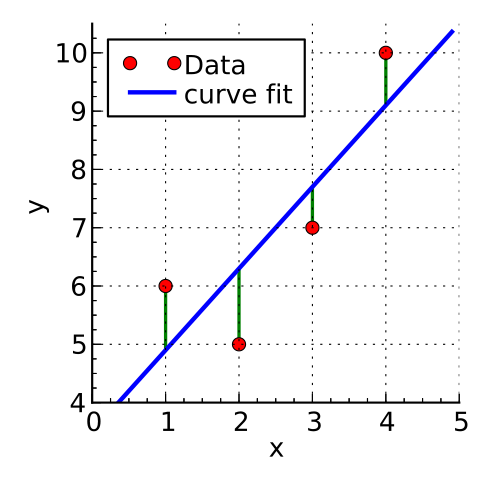
English: Illustration of least squares fitting. The data (red dots) are at co-ordinates (1,6), (2,5), (3,7) and (4,10). A linear approximation is obtained using least-squares estimation (blue line). Created using python. |
| 日期 | |
| 来源 | 自己的作品 |
| 作者 | Krishnavedala |
| 其他版本 |
File:Linear_least_squares_example2.png Derivative works of this file: |
W3C-validity not checked.
Source Code
|
|---|
from matplotlib.pyplot import *
from numpy import *
from mpl_toolkits.axisartist import *

x,y = [1.,2.,3.,4.], [6., 5., 7., 10.]
A = vstack([x, ones(len(x))]).T
b2,b1 = linalg.lstsq(A,y)[0]
x2 = arange(0,5,0.1)
y2 = lambda xx: b1+b2*xx

fig = figure(figsize=(3,3))
ax = Subplot(fig,"111",axisbg='none')
fig.add_subplot(ax)
ax.axis["right"].set_visible(False)
ax.axis["top"].set_visible(False)
ax.plot(x,y,'ro',label="Data")
ax.plot(x2,y2(x2),label="curve fit",lw=2)
ymin, ymax = [], []
for i in range(len(x)):
	yy = y2(x[i])
	if yy >= y[i]:
		ymin, ymax = append(ymin,y[i]), append(ymax,yy)
	else:
		ymin, ymax = append(ymax,yy), append(ymin,y[i])
ax.vlines(x,ymin, ymax,color='g',linestyles='solid',lw=1.5)
ax.set_ylabel("y",fontsize=12)
ax.set_xlabel("x",fontsize=12)
ax.grid(True)
ax.minorticks_on()
ax.set_xlim(0,5)
ax.set_ylim(4,10.5)
ax.legend(frameon=True, handletextpad=0,loc='upper left',\
	labelspacing=.05)
setp(ax.get_legend().get_texts(),fontsize=12)

fig.savefig("Linear_least_squares_example2.svg",bbox_inches="tight",\
	pad_inches=.15)
|
许可协议
[编辑]
我,本作品著作权人,特此采用以下许可协议发表本作品:
本文件采用知识共享署名-相同方式共享 3.0 未本地化版本许可协议授权。
- 您可以自由地:
- 共享 – 复制、发行并传播本作品
- 修改 – 改编作品
- 惟须遵守下列条件:
- 署名 – 您必须对作品进行署名,提供授权条款的链接,并说明是否对原始内容进行了更改。您可以用任何合理的方式来署名,但不得以任何方式表明许可人认可您或您的使用。
- 相同方式共享 – 如果您再混合、转换或者基于本作品进行创作,您必须以与原先许可协议相同或相兼容的许可协议分发您贡献的作品。

|
已授权您依据自由软件基金会发行的无固定段落及封面封底文字(Invariant Sections, Front-Cover Texts, and Back-Cover Texts)的GNU自由文件许可协议1.2版或任意后续版本的条款,复制、传播和/或修改本文件。该协议的副本请见“GNU Free Documentation License”。 |
您可以选择您需要的许可协议。
文件历史
点击某个日期/时间查看对应时刻的文件。
| 日期/时间 | 缩略图 | 大小 | 用户 | 备注 | |
|---|---|---|---|---|---|
| 当前 | 2011年6月10日 (五) 03:35 | | 279 × 274(50 KB) | Krishnavedala(留言 | 贡献) | {{Information |Description ={{en|1=Illustration of w:Linear_least_squares_(mathematicsleast squares fitting. The data (red dots) are at co-ordinates (1,6), (2,5), (3,7) and (4,10). A linear approximation is obtained using least-squares estimation |
您不可以覆盖此文件。
文件用途
以下7个页面使用本文件:
- File:Linear least squares example2.png
- File:Regression lineaire abscisses.svg
- File:Regression lineaire abscisses ordonnees.svg
- File:Regression lineaire abscisses ordonnees orthogonal.svg
- File:Regression lineaire ordonnees.svg
- File:Regression lineaire ordonnees orthogonal.svg
- File:Regression lineaire orthogonal.svg
全域文件用途
以下其他wiki使用此文件:
- ckb.wikipedia.org上的用途
- da.wikipedia.org上的用途
- de.wikibooks.org上的用途
- Mathematrix: AT BRP/ Theorie/ Reifeniveau 6
- Mathematrix: MA TER/ Theorie/ Statistik und Wahrscheinlichkeitsrechnung
- Mathematrix: AT BRP/ Theorie nach Thema/ Statistik und Wahrscheinlichkeitsrechnung
- Mathematrix: AT AHS/ Theorie nach Thema/ Statistik und Wahrscheinlichkeitsrechnung
- Mathematrix: BY GYM/ Theorie nach Thema/ Statistik und Wahrscheinlichkeitsrechnung
- de.wikiversity.org上的用途
- en.wikipedia.org上的用途
- ro.wikipedia.org上的用途
- uk.wikipedia.org上的用途
- zh.wikipedia.org上的用途