File:M1Usd.svg
Jump to navigation
Jump to search

Size of this PNG preview of this SVG file: 768 × 432 pixels. Other resolutions: 320 × 180 pixels | 640 × 360 pixels | 1,024 × 576 pixels | 1,280 × 720 pixels | 2,560 × 1,440 pixels.
Original file (SVG file, nominally 768 × 432 pixels, file size: 72 KB)
Captions
Captions
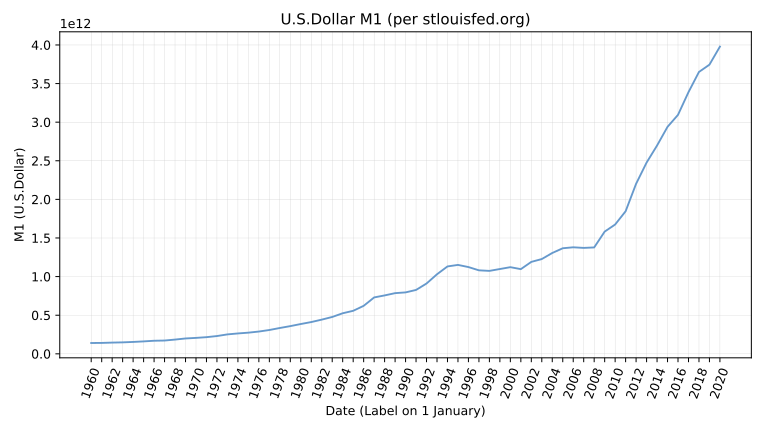
M1 for U.S.dollar
Summary[edit]
| Description |
English: M1 for U.S.dollar, plotted using the Python code from Plotting code section. |
| Date | |
| Source | Own work |
| Author | Dan Polansky |
Licensing[edit]
I, the copyright holder of this work, hereby publish it under the following license:
This file is licensed under the Creative Commons Attribution 4.0 International license.
- You are free:
- to share – to copy, distribute and transmit the work
- to remix – to adapt the work
- Under the following conditions:
- attribution – You must give appropriate credit, provide a link to the license, and indicate if changes were made. You may do so in any reasonable manner, but not in any way that suggests the licensor endorses you or your use.
Plotting code[edit]
from matplotlib import pyplot as plt
import datetime
plotVolumes = True
plot5YRates = True
# Data source: https://fred.stlouisfed.org/series/MANMM101USM189S
# Monetary Aggregates and Their Components: Narrow Money and Components: M1 and Components: M1 for United States
inputData = [
  "1960-01-01:140000000000",
  "1961-01-01:141100000000",
  "1962-01-01:145200000000",
  "1963-01-01:148300000000",
  "1964-01-01:153700000000",
  "1965-01-01:160700000000",
  "1966-01-01:169100000000",
  "1967-01-01:171900000000",
  "1968-01-01:184300000000",
  "1969-01-01:198700000000",
  "1970-01-01:206200000000",
  "1971-01-01:215500000000",
  "1972-01-01:230100000000",
  "1973-01-01:251500000000",
  "1974-01-01:263800000000",
  "1975-01-01:273900000000",
  "1976-01-01:288400000000",
  "1977-01-01:308300000000",
  "1978-01-01:334400000000",
  "1979-01-01:358600000000",
  "1980-01-01:385800000000",
  "1981-01-01:411300000000",
  "1982-01-01:442700000000",
  "1983-01-01:477200000000",
  "1984-01-01:525100000000",
  "1985-01-01:557000000000",
  "1986-01-01:621400000000",
  "1987-01-01:730200000000",
  "1988-01-01:756200000000",
  "1989-01-01:785700000000",
  "1990-01-01:795400000000",
  "1991-01-01:827200000000",
  "1992-01-01:910400000000",
  "1993-01-01:1030400000000",
  "1994-01-01:1131600000000",
  "1995-01-01:1151400000000",
  "1996-01-01:1123500000000",
  "1997-01-01:1081200000000",
  "1998-01-01:1074000000000",
  "1999-01-01:1098100000000",
  "2000-01-01:1122100000000",
  "2001-01-01:1096700000000",
  "2002-01-01:1190700000000",
  "2003-01-01:1227300000000",
  "2004-01-01:1306000000000",
  "2005-01-01:1367100000000",
  "2006-01-01:1379500000000",
  "2007-01-01:1371700000000",
  "2008-01-01:1377700000000",
  "2009-01-01:1582800000000",
  "2010-01-01:1674700000000",
  "2011-01-01:1846300000000",
  "2012-01-01:2201800000000",
  "2013-01-01:2476700000000",
  "2014-01-01:2697800000000",
  "2015-01-01:2939700000000",
  "2016-01-01:3095000000000",
  "2017-01-01:3389300000000",
  "2018-01-01:3650700000000",
  "2019-01-01:3745000000000",
  "2020-01-01:3978600000000"]
  #"2021-01-01:18098900000000" The last years are for a changed definition
  #"2022-01-01:20506300000000"
  #"2023-01-01:19555000000000"

dates = []
volumes = []
calcRates = []
for dataRowStr in inputData:
  dataRow = dataRowStr.split(":")
  date = datetime.datetime.strptime(dataRow[0], "%Y-%m-%d").date()
  volume = float(dataRow[1])
  dates.append(date)
  volumes.append(volume)
  if len(volumes) > 5:
    calcRates.append((float(volumes[-1]) / volumes[-1 - 5]) ** (1/5.0))
  else:
    calcRates.append(float("nan"))

if plotVolumes:
  fig, biax = plt.subplots()
  figSize = fig.get_size_inches()
  fig.set_size_inches(figSize[0] * 4/3, figSize[1])
  biax.set(xlabel="Date (Label on 1 January)", ylabel="M1 (U.S.Dollar)",
           title="U.S.Dollar M1 (per stlouisfed.org)")
  xtickDates, xtickDatesStr = [], []
  for idx, date in enumerate(dates):
    if date.month == 1 and date.day == 1:
      xtickDates.append(date)
      xtickDatesStr.append(str(date.year) if date.year % 2 == 0 else "")
  plt.xticks(xtickDates, xtickDatesStr, rotation=70)
  plt.plot(dates, volumes, color="#6699CC")
  plt.grid(linewidth=0.25, color="#CCCCCC")
  plt.tight_layout()
  plt.savefig("M1Usd.svg")

if plot5YRates:
  # Plot 5Y average annual rate of change
  fig, biax = plt.subplots()
  figSize = fig.get_size_inches()
  fig.set_size_inches(figSize[0] * 4/3, figSize[1])
  title="U.S.Dollar M1\n5-year average of annual rate of change (base data per stlouisfed.org)"
  biax.set(xlabel="Date (label on 1 January)", ylabel="Rate of change", title=title)
  xtickDates = []
  xtickDatesStr = []
  for idx, date in enumerate(dates):
    xtickDates.append(date)
    xtickDatesStr.append(str(date.year) if date.year % 2 == 0 else "")
  plt.xticks(xtickDates, xtickDatesStr, rotation=70)
  plt.axhline(1, color='#BBBBBB', linewidth=0.75)
  plt.plot(dates, calcRates, color="#6699CC")
  plt.grid(linewidth=0.25, color="#DDDDDD")
  values = biax.get_yticks()
  biax.set_yticklabels(['{:,.1%}'.format(x - 1) for x in values])
  plt.tight_layout()
  plt.savefig("M1Usd5YAvgChangeRate.svg")

|
This media file is uncategorized.
Please help improve this media file by adding it to one or more categories, so it may be associated with related media files (how?), and so that it can be more easily found.
Please notify the uploader with {{subst:Please link images|File:M1Usd.svg}} ~~~~ |
File history
Click on a date/time to view the file as it appeared at that time.
| Date/Time | Thumbnail | Dimensions | User | Comment | |
|---|---|---|---|---|---|
| current | 15:47, 10 April 2024 | | 768 × 432 (72 KB) | Dan Polansky (talk | contribs) | Uploaded own work with UploadWizard |
You cannot overwrite this file.
File usage on Commons
There are no pages that use this file.
File usage on other wikis
The following other wikis use this file:
- Usage on en.wikiversity.org