File:Masa lodowcowa.PNG
Masa_lodowcowa.PNG (658 × 500 pixels, file size: 16 KB, MIME type: image/png)
Captions
Captions
Summary
[edit]| Description |
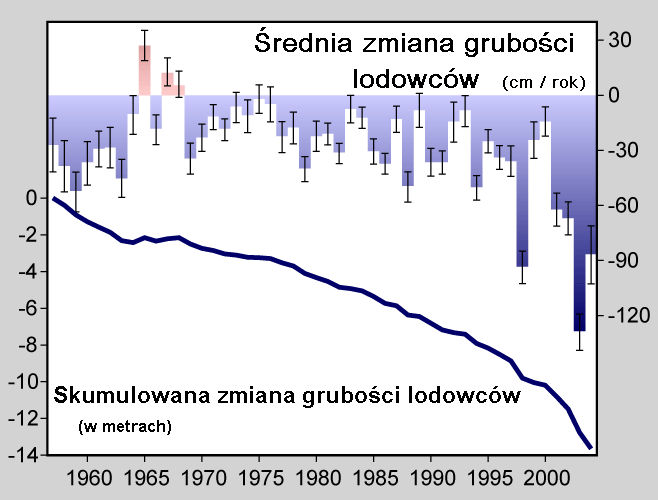
Measurements are shown as both the annual average thickness change and the accumulated change during the fifty years of measurements presented. Years with a net increase in glacier thickness are plotted upwards and in red; years with a net decrease in glacier thickness (i.e. positive thinning) are plotted downward and in blue. Only three years in the last 50 have experienced thickening in the average. Systematic measurements of glacier thinning began in the 1940s, but fewer than 15 sites had been measured each year until the late 1950s. Since then more than 100 sites have contributed to the average in some years (Dyurgerov 2002, Dyurgerov and Meier 2005). Error bars indicate the standard error in the mean. Other observations, based on glacier length records, suggest that glacier retreat has occurred nearly continuously since the early 1800s and the end of the little ice age, but variations in rate have occurred, including a significant acceleration during the twentieth century that is believed to have been a response to global warming (Oerlemans 2005). |
||||||||
| Date | |||||||||
| Source | These measurements are described in Dyurgerov (2002), updated in Dyurgerov and Meier (2005), and archived at the World Glacier Monitoring Service at the National Snow and Ice Data Center. [1] [2] | ||||||||
| Author |
przetłumaczył dla pl wiki Dobrzejest, wikipedia.pl : Adi4000[3] Autor oryginalny: This figure was prepared by Robert A. Rohde from published data and is part of the Global Warming Art project. Image from Global Warming Art
This image is an original work created for Global Warming Art. Please refer to the image description page for more information.
|

Licensing
[edit]
| This file is licensed under the Creative Commons Attribution-Share Alike 3.0 Unported license. Subject to disclaimers. | ||
| ||
| This licensing tag was added to this file as part of the GFDL licensing update. |

|
Permission is granted to copy, distribute and/or modify this document under the terms of the GNU Free Documentation License, Version 1.2 or any later version published by the Free Software Foundation; with no Invariant Sections, no Front-Cover Texts, and no Back-Cover Texts. A copy of the license is included in the section entitled GNU Free Documentation License. Subject to disclaimers. |
File history
Click on a date/time to view the file as it appeared at that time.
| Date/Time | Thumbnail | Dimensions | User | Comment | |
|---|---|---|---|---|---|
| current | 14:52, 17 June 2009 | | 658 × 500 (16 KB) | Adi (talk | contribs) | korekta wyrazu |
| 18:54, 28 March 2008 |  | 658 × 500 (21 KB) | Adi (talk | contribs) | {{Information |Description=:This figure shows the average rate of thickness change in mountain glaciers around the world. This information, known as the glaciological mass balance, is found by measuring |
You cannot overwrite this file.
File usage on Commons
There are no pages that use this file.
File usage on other wikis
The following other wikis use this file: