File:MitigationOptions costs potentials IPCCAR6WGIII rotated-de.svg

Original file (SVG file, nominally 1,055 × 1,099 pixels, file size: 205 KB)
Captions
Captions
Summary[edit]
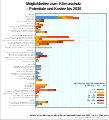
| DescriptionMitigationOptions costs potentials IPCCAR6WGIII rotated-de.svg | Mitigation options: Cost and potential (2030) |
| Date | |
| Source | based upon IPCC AR6, WG3, SPM.7 |
| Author | of base image: IPCC, of this plot: User:DeWikiMan |
Data: Data_2030_costs_and_potentials_AR6_WGIII_SPM.7.xlsx (doi:10.48490/ayfg-tv12)
To reproduce, first create a CSV-file out of the above Excel-Sheet. It should look like this (excerpt):
{/:Bold Energie};0;0;0;0;0;0;0;;0;0
Windenergie;2.31;0.77;0.77;0;0;0;3.85;smooth;2.1;5.6
Solarenergie;2.7;0.6;0.6;0.6;0;0;4.5;smooth;2;7
…
Weniger Methanemission bei Öl u.Gas;0.31;0.61;0.07;0.06;0.1;0;1.15;;0.67;1.61
;0;0;0;0;0;0;0;;0;0
{/:Bold Land- u. Forstwirtschaft, Landnutzung};0;0;0;0;0;0;0;;0;0
CO_2-Sequestrierung in der Landwirtschaft;0;0.5;0.73;2.21;0;0;3.44;;1.5;5.5
…
Plot with Gnuplot 4.4 using the following script.
Then load into Inkscape, rotate, add title, remove unneccessary ticks.
set terminal svg size 1000 1200 enhanced fname "Liberation Sans" fsize 13
set output "MitigationOptions_costs_potentials_IPCCAR6WGIII-de.svg"
set datafile missing '"#N/A"'
set datafile separator ";"
unset title # 'Mitigationsoptionen, Potentiale und Kosten (2030)' font "Liberation Sans, 32 bold"

set label 'Daten: IPCC AR6, WG III für SPM.7 (ohne Glättung)' rotate by 90 at screen 0.982,0.93 right font "Liberation Sans, 11"

set obj 1 rectangle behind from screen 0,0 to screen 1,1
set obj 1 fillstyle solid 1.0 fillcolor rgbcolor "white"
set obj 2 rectangle behind from graph 0,0 to graph 1,1
set obj 2 fillstyle solid 1.0 fillcolor rgbcolor "#F0FFFF"

set auto x
set y2range [0:8] reverse
set xrange [-1:54]
set xtics out rotate nomirror
set xtics format ""
set y2tics right out rotate nomirror
set my2tics 2
set grid noxtics my2tics y2tics lt 0 lw 0.5 lc "black"
set y2label 'Potentieller Beitrag zu Netto-Emissionsreduktionen bis 2030, in Gt CO_{2}eq pro Jahr' font "Liberation Sans, 16 bold"
unset ytics

set boxwidth 0.9 relative
set style data histograms
set style histogram rowstacked
set style fill solid 1.0 # border -1

plot 'Data_2030_costs_and_potentials_AR6_WGIII_SPM7-de.csv' using 2:xtic(1) axes x1y2 notitle linecolor rgb "#5190cc", \
     '' using 3 axes x1y2 notitle linecolor rgb "#f7a800", \
     '' using 4 axes x1y2 notitle linecolor rgb "#e7713b", \
     '' using 5 axes x1y2 notitle linecolor rgb "#de4911", \
     '' using 6 axes x1y2 notitle linecolor rgb "#9e2b18", \
     '' using 7 axes x1y2 notitle linecolor rgb "#adadad", \
     '' using 0:8:10:11 axes x1y2 notitle with errorbars pointsize 0 linecolor rgb "#888888"
Licensing[edit]

|
Permission is granted to copy, distribute and/or modify this document under the terms of the GNU Free Documentation License, Version 1.2 or any later version published by the Free Software Foundation; with no Invariant Sections, no Front-Cover Texts, and no Back-Cover Texts. A copy of the license is included in the section entitled GNU Free Documentation License.http://www.gnu.org/copyleft/fdl.htmlGFDLGNU Free Documentation Licensetruetrue |
- You are free:
- to share – to copy, distribute and transmit the work
- to remix – to adapt the work
- Under the following conditions:
- attribution – You must give appropriate credit, provide a link to the license, and indicate if changes were made. You may do so in any reasonable manner, but not in any way that suggests the licensor endorses you or your use.
- share alike – If you remix, transform, or build upon the material, you must distribute your contributions under the same or compatible license as the original.
File history
Click on a date/time to view the file as it appeared at that time.
| Date/Time | Thumbnail | Dimensions | User | Comment | |
|---|---|---|---|---|---|
| current | 19:18, 21 March 2023 |  | 1,055 × 1,099 (205 KB) | DeWikiMan (talk | contribs) | verloren gegangene Legende wieder ergänzt |
| 19:26, 9 August 2022 |  | 1,055 × 1,099 (195 KB) | DeWikiMan (talk | contribs) | error in axes fixed | |
| 18:33, 9 August 2022 |  | 1,002 × 1,099 (223 KB) | DeWikiMan (talk | contribs) | Gt -> Mrd. Tonnen | |
| 12:23, 5 August 2022 |  | 1,002 × 1,099 (223 KB) | DeWikiMan (talk | contribs) | unnecessary ticks removed | |
| 19:31, 28 June 2022 |  | 1,002 × 1,099 (226 KB) | DeWikiMan (talk | contribs) | some labels, y-tics and -label at the bottom, size | |
| 19:22, 27 June 2022 |  | 1,001 × 1,201 (212 KB) | DeWikiMan (talk | contribs) | Translations and font changed, more minor tweaks | |
| 19:03, 26 June 2022 |  | 1,001 × 1,201 (175 KB) | DeWikiMan (talk | contribs) | {{Information |Description=Mitigation options: Cost and potential (2030) |Source=based upon IPCC AR6, WG3, SPM.7 |Date=2022-06-26 |Author=of base image: IPCC, of this plot: User:DeWikiMan |Permission= |other_versions= }} More details will be added later. Category:Climate change mitigation |
You cannot overwrite this file.
File usage on Commons
There are no pages that use this file.
File usage on other wikis
The following other wikis use this file:
Metadata
This file contains additional information such as Exif metadata which may have been added by the digital camera, scanner, or software program used to create or digitize it. If the file has been modified from its original state, some details such as the timestamp may not fully reflect those of the original file. The timestamp is only as accurate as the clock in the camera, and it may be completely wrong.
| Short title | Gnuplot |
|---|---|
| Image title | Produced by GNUPLOT 5.0 patchlevel 3 |
| Width | 1055.1561 |
| Height | 1098.5291 |